
|
Shandong Bohui Paper Industry Co., Ltd. (600966.SS) DCF Avaliação |
Totalmente Editável: Adapte-Se Às Suas Necessidades No Excel Ou Planilhas
Design Profissional: Modelos Confiáveis E Padrão Da Indústria
Pré-Construídos Para Uso Rápido E Eficiente
Compatível com MAC/PC, totalmente desbloqueado
Não É Necessária Experiência; Fácil De Seguir
Shandong Bohui Paper Industry Co., Ltd. (600966.SS) Bundle
Explore o potencial financeiro da Shandong Bohui Paper Industry Co., Ltd. (600966Ss) com nossa calculadora DCF amigável! Digite suas projeções de crescimento, margens de lucro e despesas para calcular o valor intrínseco da Shandong Bohui Paper Industry Co., Ltd. (600966Ss) e aprimore sua abordagem de investimento.
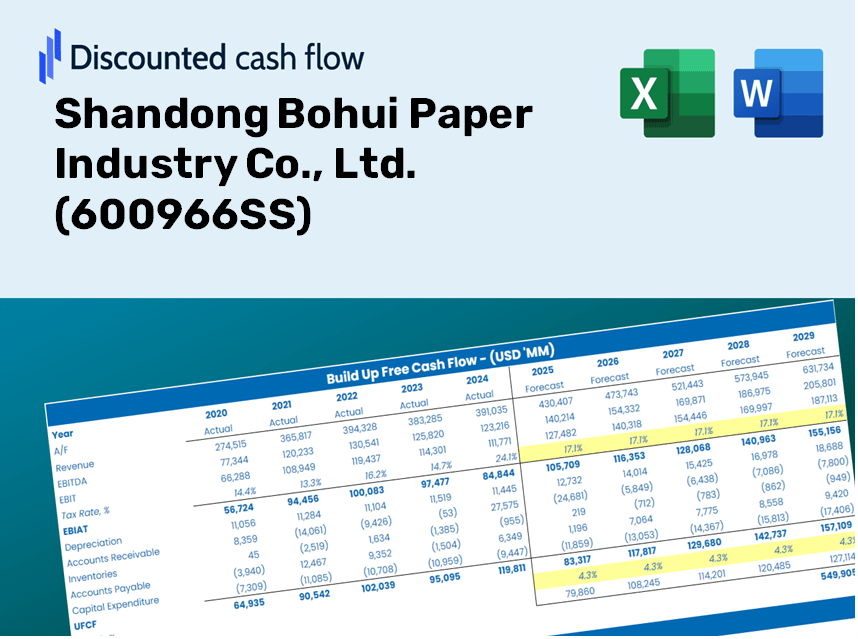
Discounted Cash Flow (DCF) - (USD MM)
| Year | AY1 2020 |
AY2 2021 |
AY3 2022 |
AY4 2023 |
AY5 2024 |
FY1 2025 |
FY2 2026 |
FY3 2027 |
FY4 2028 |
FY5 2029 |
|---|---|---|---|---|---|---|---|---|---|---|
| Revenue | 13,982.1 | 16,276.1 | 18,361.8 | 18,693.1 | 18,930.4 | 19,009.2 | 19,088.4 | 19,167.9 | 19,247.7 | 19,327.8 |
| Revenue Growth, % | 0 | 16.41 | 12.81 | 1.8 | 1.27 | 0.41642 | 0.41642 | 0.41642 | 0.41642 | 0.41642 |
| EBITDA | 2,445.4 | 3,322.2 | 1,348.3 | 1,254.2 | 1,301.4 | 2,236.5 | 2,245.8 | 2,255.2 | 2,264.6 | 2,274.0 |
| EBITDA, % | 17.49 | 20.41 | 7.34 | 6.71 | 6.87 | 11.77 | 11.77 | 11.77 | 11.77 | 11.77 |
| Depreciation | 787.9 | 773.0 | 811.2 | 704.2 | 787.5 | 864.1 | 867.7 | 871.3 | 874.9 | 878.6 |
| Depreciation, % | 5.63 | 4.75 | 4.42 | 3.77 | 4.16 | 4.55 | 4.55 | 4.55 | 4.55 | 4.55 |
| EBIT | 1,657.5 | 2,549.3 | 537.1 | 550.0 | 513.9 | 1,372.4 | 1,378.2 | 1,383.9 | 1,389.7 | 1,395.4 |
| EBIT, % | 11.85 | 15.66 | 2.93 | 2.94 | 2.71 | 7.22 | 7.22 | 7.22 | 7.22 | 7.22 |
| Total Cash | 2,841.9 | 3,358.5 | 2,497.0 | 3,464.0 | 3,078.2 | 3,397.0 | 3,411.1 | 3,425.3 | 3,439.6 | 3,453.9 |
| Total Cash, percent | .0 | .0 | .0 | .0 | .0 | .0 | .0 | .0 | .0 | .0 |
| Account Receivables | 1,666.3 | 1,484.2 | 1,520.0 | 1,739.8 | 2,108.1 | 1,891.7 | 1,899.6 | 1,907.5 | 1,915.4 | 1,923.4 |
| Account Receivables, % | 11.92 | 9.12 | 8.28 | 9.31 | 11.14 | 9.95 | 9.95 | 9.95 | 9.95 | 9.95 |
| Inventories | 1,503.8 | 2,094.7 | 3,728.0 | 2,495.8 | 2,419.2 | 2,663.5 | 2,674.6 | 2,685.8 | 2,697.0 | 2,708.2 |
| Inventories, % | 10.76 | 12.87 | 20.3 | 13.35 | 12.78 | 14.01 | 14.01 | 14.01 | 14.01 | 14.01 |
| Accounts Payable | 4,964.5 | 4,603.1 | 6,238.9 | 5,498.3 | 4,347.1 | 5,708.2 | 5,731.9 | 5,755.8 | 5,779.8 | 5,803.8 |
| Accounts Payable, % | 35.51 | 28.28 | 33.98 | 29.41 | 22.96 | 30.03 | 30.03 | 30.03 | 30.03 | 30.03 |
| Capital Expenditure | -336.9 | -308.3 | -1,500.6 | -541.0 | -549.4 | -694.7 | -697.6 | -700.5 | -703.4 | -706.3 |
| Capital Expenditure, % | -2.41 | -1.89 | -8.17 | -2.89 | -2.9 | -3.65 | -3.65 | -3.65 | -3.65 | -3.65 |
| Tax Rate, % | 14.66 | 14.66 | 14.66 | 14.66 | 14.66 | 14.66 | 14.66 | 14.66 | 14.66 | 14.66 |
| EBITAT | 1,265.0 | 1,939.6 | 543.6 | 456.1 | 438.6 | 1,154.7 | 1,159.5 | 1,164.4 | 1,169.2 | 1,174.1 |
| Depreciation | ||||||||||
| Changes in Account Receivables | ||||||||||
| Changes in Inventories | ||||||||||
| Changes in Accounts Payable | ||||||||||
| Capital Expenditure | ||||||||||
| UFCF | 3,510.4 | 1,634.0 | -179.1 | 891.1 | -766.3 | 2,657.3 | 1,334.4 | 1,340.0 | 1,345.6 | 1,351.2 |
| WACC, % | 5.16 | 5.15 | 5.86 | 5.35 | 5.42 | 5.39 | 5.39 | 5.39 | 5.39 | 5.39 |
| PV UFCF | ||||||||||
| SUM PV UFCF | 6,997.5 | |||||||||
| Long Term Growth Rate, % | 3.50 | |||||||||
| Free cash flow (T + 1) | 1,398 | |||||||||
| Terminal Value | 74,012 | |||||||||
| Present Terminal Value | 56,926 | |||||||||
| Enterprise Value | 63,924 | |||||||||
| Net Debt | 4,213 | |||||||||
| Equity Value | 59,711 | |||||||||
| Diluted Shares Outstanding, MM | 1,236 | |||||||||
| Equity Value Per Share | 48.29 |
What You'll Receive
- Customizable Forecast Inputs: Effortlessly adjust key variables (growth %, margins, WACC) to explore various scenarios.
- Comprehensive Data Insights: Pre-loaded financial information for Shandong Bohui Paper Industry Co., Ltd. ([600966SS]) to facilitate your analysis.
- Instant DCF Calculations: The template automatically determines Net Present Value (NPV) and intrinsic value on your behalf.
- Sleek and Adaptable: A refined Excel model designed to fit your valuation requirements.
- Tailored for Analysts and Investors: Perfect for evaluating projections, confirming strategies, and optimizing efficiency.
Key Features
- Customizable Forecast Inputs: Adjust essential factors such as sales growth, profit margins, and investment expenditures.
- Instant DCF Valuation: Provides immediate calculations of intrinsic value, net present value (NPV), and other financial metrics.
- Accurate Financial Insights: Leverages Shandong Bohui Paper Industry Co., Ltd.'s real financial data for dependable valuation results.
- Seamless Scenario Testing: Effortlessly explore various assumptions and evaluate their impacts on outcomes.
- Efficiency Boost: Streamline your process by avoiding the construction of intricate valuation models from the ground up.
How It Functions
- Step 1: Download the preconfigured Excel template featuring Shandong Bohui Paper Industry Co., Ltd. (600966SS) data.
- Step 2: Review the pre-filled spreadsheets to familiarize yourself with the essential metrics.
- Step 3: Adjust forecasts and assumptions in the editable yellow fields (WACC, growth, margins).
- Step 4: Instantly see the updated results, including the intrinsic value of Shandong Bohui Paper Industry Co., Ltd. (600966SS).
- Step 5: Utilize the outputs to make informed investment decisions or to create reports.
Why Opt for This Calculator?
- Designed for Experts: A high-quality tool utilized by analysts, CFOs, and consultants in the industry.
- Accurate Data: Shandong Bohui Paper Industry Co., Ltd.’s historical and projected financial data preloaded for precision.
- Flexible Scenario Analysis: Easily explore varied forecasts and assumptions.
- Comprehensive Outputs: Automatically computes intrinsic value, NPV, and essential metrics.
- User-Friendly: Step-by-step guidance simplifies the process for all users.
Who Can Benefit from Shandong Bohui Paper Industry Co., Ltd. (600966SS)?
- Investors: Make informed investment choices with our comprehensive analysis tools.
- Financial Analysts: Streamline your workflow with our fully customizable financial models.
- Consultants: Easily modify our resources for client reports and presentations.
- Paper Industry Enthusiasts: Enhance your knowledge of the market with practical insights and examples.
- Educators and Students: Utilize our materials as a valuable educational resource in finance and industry courses.
Contents of the Template
- Operating and Balance Sheet Data: Pre-filled historical data and forecasts for Shandong Bohui Paper Industry Co., Ltd. (600966SS), including revenue, EBITDA, EBIT, and capital expenditures.
- WACC Calculation: A dedicated worksheet for Weighted Average Cost of Capital (WACC) featuring parameters such as Beta, risk-free rate, and share price.
- DCF Valuation (Unlevered and Levered): Customizable Discounted Cash Flow models showcasing intrinsic value along with comprehensive calculations.
- Financial Statements: Pre-loaded annual and quarterly financial statements to facilitate analysis.
- Key Ratios: Includes important profitability, leverage, and efficiency ratios for Shandong Bohui Paper Industry Co., Ltd. (600966SS).
- Dashboard and Charts: Visual representation of valuation outputs and assumptions for easier analysis of results.
Disclaimer
All information, articles, and product details provided on this website are for general informational and educational purposes only. We do not claim any ownership over, nor do we intend to infringe upon, any trademarks, copyrights, logos, brand names, or other intellectual property mentioned or depicted on this site. Such intellectual property remains the property of its respective owners, and any references here are made solely for identification or informational purposes, without implying any affiliation, endorsement, or partnership.
We make no representations or warranties, express or implied, regarding the accuracy, completeness, or suitability of any content or products presented. Nothing on this website should be construed as legal, tax, investment, financial, medical, or other professional advice. In addition, no part of this site—including articles or product references—constitutes a solicitation, recommendation, endorsement, advertisement, or offer to buy or sell any securities, franchises, or other financial instruments, particularly in jurisdictions where such activity would be unlawful.
All content is of a general nature and may not address the specific circumstances of any individual or entity. It is not a substitute for professional advice or services. Any actions you take based on the information provided here are strictly at your own risk. You accept full responsibility for any decisions or outcomes arising from your use of this website and agree to release us from any liability in connection with your use of, or reliance upon, the content or products found herein.