
|
CNOOC Energy Technology & Serviços Limited (600968.SS) Avaliação DCF |
Totalmente Editável: Adapte-Se Às Suas Necessidades No Excel Ou Planilhas
Design Profissional: Modelos Confiáveis E Padrão Da Indústria
Pré-Construídos Para Uso Rápido E Eficiente
Compatível com MAC/PC, totalmente desbloqueado
Não É Necessária Experiência; Fácil De Seguir
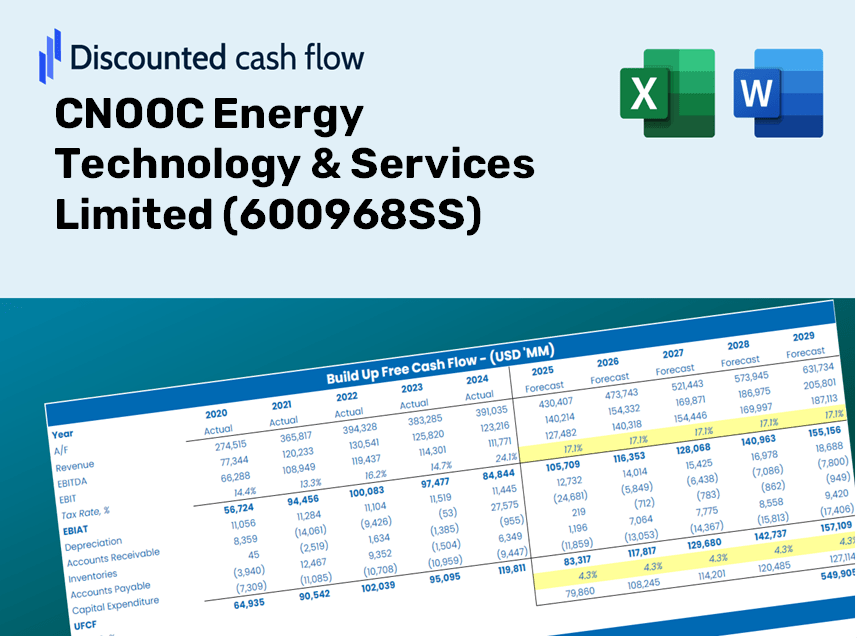
CNOOC Energy Technology & Services Limited (600968.SS) Bundle
Avalie a tecnologia de energia CNOOC & Perspectivas financeiras da Services Limited como um especialista! Esta calculadora (600968SS) DCF fornece finanças pré-populadas e a liberdade de modificar o crescimento da receita, o WACC, as margens e outras suposições críticas para se alinhar às suas projeções.
Discounted Cash Flow (DCF) - (USD MM)
| Year | AY1 2020 |
AY2 2021 |
AY3 2022 |
AY4 2023 |
AY5 2024 |
FY1 2025 |
FY2 2026 |
FY3 2027 |
FY4 2028 |
FY5 2029 |
|---|---|---|---|---|---|---|---|---|---|---|
| Revenue | 33,208.3 | 38,739.3 | 47,784.5 | 49,308.0 | 52,516.9 | 51,414.5 | 50,335.2 | 49,278.5 | 48,244.1 | 47,231.3 |
| Revenue Growth, % | 0 | 16.66 | 23.35 | 3.19 | 6.51 | -2.1 | -2.1 | -2.1 | -2.1 | -2.1 |
| EBITDA | 3,237.6 | 3,737.6 | 3,986.1 | 4,853.7 | 6,213.0 | 5,081.1 | 4,974.4 | 4,870.0 | 4,767.8 | 4,667.7 |
| EBITDA, % | 9.75 | 9.65 | 8.34 | 9.84 | 11.83 | 9.88 | 9.88 | 9.88 | 9.88 | 9.88 |
| Depreciation | 1,518.5 | 1,556.9 | 1,598.6 | 1,597.9 | 1,757.5 | 1,904.8 | 1,864.9 | 1,825.7 | 1,787.4 | 1,749.9 |
| Depreciation, % | 4.57 | 4.02 | 3.35 | 3.24 | 3.35 | 3.7 | 3.7 | 3.7 | 3.7 | 3.7 |
| EBIT | 1,719.0 | 2,180.7 | 2,387.5 | 3,255.8 | 4,455.4 | 3,176.3 | 3,109.6 | 3,044.3 | 2,980.4 | 2,917.8 |
| EBIT, % | 5.18 | 5.63 | 5 | 6.6 | 8.48 | 6.18 | 6.18 | 6.18 | 6.18 | 6.18 |
| Total Cash | 3,908.7 | 5,077.9 | 6,993.1 | 10,787.6 | 11,886.5 | 8,640.2 | 8,458.8 | 8,281.2 | 8,107.4 | 7,937.2 |
| Total Cash, percent | .0 | .0 | .0 | .0 | .0 | .0 | .0 | .0 | .0 | .0 |
| Account Receivables | 11,555.3 | 13,124.0 | 14,973.5 | 12,727.2 | 13,881.7 | 15,656.1 | 15,327.5 | 15,005.7 | 14,690.7 | 14,382.3 |
| Account Receivables, % | 34.8 | 33.88 | 31.34 | 25.81 | 26.43 | 30.45 | 30.45 | 30.45 | 30.45 | 30.45 |
| Inventories | 591.7 | 750.0 | 855.4 | 748.9 | 1,014.1 | 921.1 | 901.8 | 882.8 | 864.3 | 846.2 |
| Inventories, % | 1.78 | 1.94 | 1.79 | 1.52 | 1.93 | 1.79 | 1.79 | 1.79 | 1.79 | 1.79 |
| Accounts Payable | 8,320.9 | 9,787.9 | 11,284.4 | 12,724.1 | 13,841.9 | 12,966.8 | 12,694.6 | 12,428.1 | 12,167.2 | 11,911.8 |
| Accounts Payable, % | 25.06 | 25.27 | 23.62 | 25.81 | 26.36 | 25.22 | 25.22 | 25.22 | 25.22 | 25.22 |
| Capital Expenditure | -554.3 | -1,442.3 | -2,272.6 | -2,222.4 | -2,205.5 | -1,938.8 | -1,898.1 | -1,858.3 | -1,819.3 | -1,781.1 |
| Capital Expenditure, % | -1.67 | -3.72 | -4.76 | -4.51 | -4.2 | -3.77 | -3.77 | -3.77 | -3.77 | -3.77 |
| Tax Rate, % | 20.17 | 20.17 | 20.17 | 20.17 | 20.17 | 20.17 | 20.17 | 20.17 | 20.17 | 20.17 |
| EBITAT | 1,246.8 | 1,458.0 | 1,933.0 | 2,602.8 | 3,556.9 | 2,414.8 | 2,364.1 | 2,314.4 | 2,265.8 | 2,218.3 |
| Depreciation | ||||||||||
| Changes in Account Receivables | ||||||||||
| Changes in Inventories | ||||||||||
| Changes in Accounts Payable | ||||||||||
| Capital Expenditure | ||||||||||
| UFCF | -1,615.0 | 1,312.5 | 800.5 | 5,770.9 | 2,807.0 | -175.8 | 2,406.6 | 2,356.1 | 2,306.6 | 2,258.2 |
| WACC, % | 4.82 | 4.8 | 4.84 | 4.84 | 4.84 | 4.83 | 4.83 | 4.83 | 4.83 | 4.83 |
| PV UFCF | ||||||||||
| SUM PV UFCF | 7,762.2 | |||||||||
| Long Term Growth Rate, % | 3.00 | |||||||||
| Free cash flow (T + 1) | 2,326 | |||||||||
| Terminal Value | 127,385 | |||||||||
| Present Terminal Value | 100,641 | |||||||||
| Enterprise Value | 108,403 | |||||||||
| Net Debt | -3,718 | |||||||||
| Equity Value | 112,121 | |||||||||
| Diluted Shares Outstanding, MM | 10,164 | |||||||||
| Equity Value Per Share | 11.03 |
What You Will Receive
- Authentic CNOOC Financial Data: Pre-loaded with CNOOC’s historical and forecasted figures for accurate analysis.
- Completely Customizable Template: Easily adjust key parameters like revenue growth, WACC, and EBITDA %.
- Instant Calculations: Witness the update of CNOOC's intrinsic value in real-time as you make changes.
- Expert Valuation Tool: Tailored for investors, analysts, and consultants aiming for precise DCF outcomes.
- Intuitive User Interface: Clear layout and straightforward guidance suitable for all skill levels.
Key Features
- Comprehensive Data: Access CNOOC Energy Technology & Services Limited’s (600968SS) historical financial reports and pre-populated projections.
- Customizable Inputs: Adjust WACC, tax rates, revenue growth, and EBITDA margins to fit your analysis.
- Real-Time Insights: Observe the recalculation of CNOOC’s (600968SS) intrinsic value as you modify inputs.
- Intuitive Visuals: Dashboard charts present valuation outcomes and essential metrics clearly.
- Designed for Precision: A reliable solution tailored for analysts, investors, and finance professionals.
How It Works
- Step 1: Download the Excel file.
- Step 2: Examine the pre-filled data for CNOOC Energy Technology & Services Limited (600968SS) (historical and projected).
- Step 3: Modify key assumptions (highlighted in yellow) to reflect your analysis.
- Step 4: Observe the automatic recalculations for the intrinsic value of CNOOC Energy Technology & Services Limited (600968SS).
- Step 5: Utilize the results for making investment decisions or for reporting purposes.
Why Opt for This Calculator?
- User-Friendly Interface: Suitable for both novices and experienced users.
- Customizable Assumptions: Modify inputs effortlessly to align with your specific analysis.
- Real-Time Updates: Observe immediate changes to CNOOC's valuation as you alter inputs.
- Preloaded Data: Comes with CNOOC's actual financial figures for a swift analysis.
- Relied Upon by Experts: Utilized by investors and analysts for making well-informed decisions.
Who Would Benefit from This Product?
- Institutional Investors: Create precise and robust valuation models for portfolio management and analysis of CNOOC Energy Technology & Services Limited (600968SS).
- Corporate Finance Departments: Evaluate different valuation scenarios to inform strategic planning within the organization.
- Financial Consultants and Advisors: Deliver clients reliable valuation insights related to CNOOC Energy Technology & Services Limited (600968SS).
- Students and Instructors: Utilize real-time data for practicing and teaching financial modeling techniques.
- Energy Sector Enthusiasts: Gain insights into how companies like CNOOC Energy Technology & Services Limited (600968SS) are valued in the energy market.
Contents of the Template
- Pre-Filled DCF Model: CNOOC Energy Technology & Services Limited’s (600968SS) financial data preloaded for immediate analysis.
- WACC Calculator: Comprehensive calculations for the Weighted Average Cost of Capital.
- Financial Ratios: Assess CNOOC’s profitability, leverage, and operational efficiency.
- Editable Inputs: Modify assumptions such as growth rates, profit margins, and capital expenditures to align with your projections.
- Financial Statements: Access annual and quarterly reports to facilitate in-depth evaluations.
- Interactive Dashboard: Effortlessly visualize essential valuation metrics and outcomes.
Disclaimer
All information, articles, and product details provided on this website are for general informational and educational purposes only. We do not claim any ownership over, nor do we intend to infringe upon, any trademarks, copyrights, logos, brand names, or other intellectual property mentioned or depicted on this site. Such intellectual property remains the property of its respective owners, and any references here are made solely for identification or informational purposes, without implying any affiliation, endorsement, or partnership.
We make no representations or warranties, express or implied, regarding the accuracy, completeness, or suitability of any content or products presented. Nothing on this website should be construed as legal, tax, investment, financial, medical, or other professional advice. In addition, no part of this site—including articles or product references—constitutes a solicitation, recommendation, endorsement, advertisement, or offer to buy or sell any securities, franchises, or other financial instruments, particularly in jurisdictions where such activity would be unlawful.
All content is of a general nature and may not address the specific circumstances of any individual or entity. It is not a substitute for professional advice or services. Any actions you take based on the information provided here are strictly at your own risk. You accept full responsibility for any decisions or outcomes arising from your use of this website and agree to release us from any liability in connection with your use of, or reliance upon, the content or products found herein.