
|
Zhejiang Hangmin Co., Ltd (600987.SS) Avaliação DCF |
Totalmente Editável: Adapte-Se Às Suas Necessidades No Excel Ou Planilhas
Design Profissional: Modelos Confiáveis E Padrão Da Indústria
Pré-Construídos Para Uso Rápido E Eficiente
Compatível com MAC/PC, totalmente desbloqueado
Não É Necessária Experiência; Fácil De Seguir
Zhejiang Hangmin Co.,Ltd (600987.SS) Bundle
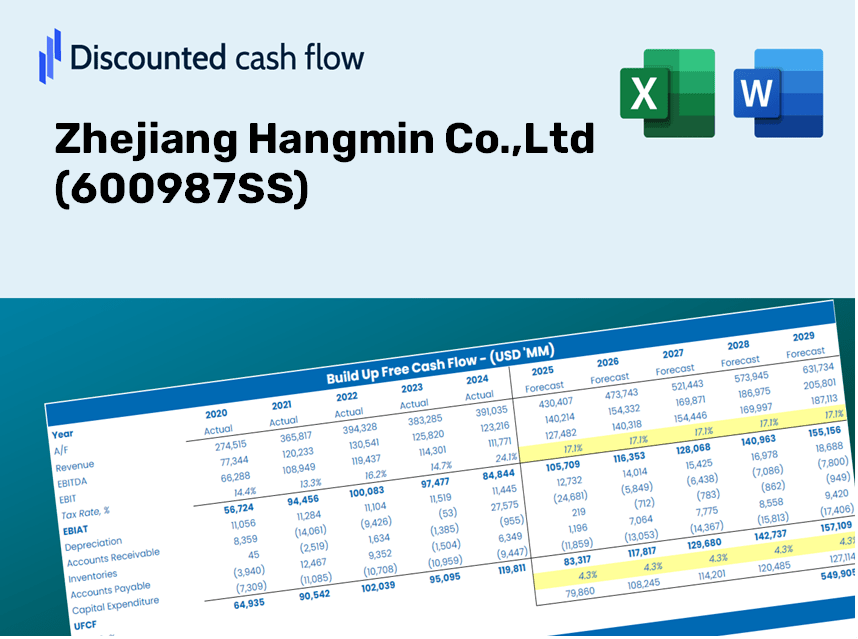
Projetado para precisão, nossa calculadora DCF (600987SS) permite avaliar a avaliação da Zhejiang Hangmin Co., LTD, usando dados financeiros do mundo real, oferecendo flexibilidade completa para modificar todos os parâmetros essenciais para projeções aprimoradas.
Discounted Cash Flow (DCF) - (USD MM)
| Year | AY1 2020 |
AY2 2021 |
AY3 2022 |
AY4 2023 |
AY5 2024 |
FY1 2025 |
FY2 2026 |
FY3 2027 |
FY4 2028 |
FY5 2029 |
|---|---|---|---|---|---|---|---|---|---|---|
| Revenue | 5,232.8 | 9,491.2 | 9,570.3 | 9,665.7 | 11,467.9 | 11,872.7 | 12,291.8 | 12,725.7 | 13,174.9 | 13,640.0 |
| Revenue Growth, % | 0 | 81.38 | 0.83387 | 0.99638 | 18.65 | 3.53 | 3.53 | 3.53 | 3.53 | 3.53 |
| EBITDA | 934.3 | 1,059.7 | 1,024.2 | 1,094.1 | 1,281.6 | 1,477.4 | 1,529.5 | 1,583.5 | 1,639.4 | 1,697.3 |
| EBITDA, % | 17.85 | 11.17 | 10.7 | 11.32 | 11.18 | 12.44 | 12.44 | 12.44 | 12.44 | 12.44 |
| Depreciation | 257.1 | 262.9 | 263.0 | 263.4 | 276.8 | 369.7 | 382.8 | 396.3 | 410.3 | 424.8 |
| Depreciation, % | 4.91 | 2.77 | 2.75 | 2.72 | 2.41 | 3.11 | 3.11 | 3.11 | 3.11 | 3.11 |
| EBIT | 677.1 | 796.8 | 761.2 | 830.7 | 1,004.9 | 1,107.6 | 1,146.7 | 1,187.2 | 1,229.1 | 1,272.5 |
| EBIT, % | 12.94 | 8.4 | 7.95 | 8.59 | 8.76 | 9.33 | 9.33 | 9.33 | 9.33 | 9.33 |
| Total Cash | 2,742.8 | 2,999.4 | 3,454.2 | 3,910.9 | 3,945.0 | 4,629.7 | 4,793.2 | 4,962.4 | 5,137.5 | 5,318.9 |
| Total Cash, percent | .0 | .0 | .0 | .0 | .0 | .0 | .0 | .0 | .0 | .0 |
| Account Receivables | 526.4 | 745.6 | 664.3 | 662.6 | 789.9 | 916.6 | 949.0 | 982.5 | 1,017.1 | 1,053.0 |
| Account Receivables, % | 10.06 | 7.86 | 6.94 | 6.86 | 6.89 | 7.72 | 7.72 | 7.72 | 7.72 | 7.72 |
| Inventories | 1,289.0 | 1,488.1 | 1,542.4 | 1,796.7 | 2,742.8 | 2,349.2 | 2,432.1 | 2,518.0 | 2,606.9 | 2,698.9 |
| Inventories, % | 24.63 | 15.68 | 16.12 | 18.59 | 23.92 | 19.79 | 19.79 | 19.79 | 19.79 | 19.79 |
| Accounts Payable | 181.8 | 198.1 | 199.5 | 270.7 | 254.2 | 300.7 | 311.3 | 322.3 | 333.7 | 345.5 |
| Accounts Payable, % | 3.47 | 2.09 | 2.08 | 2.8 | 2.22 | 2.53 | 2.53 | 2.53 | 2.53 | 2.53 |
| Capital Expenditure | -220.9 | -278.5 | -223.8 | -226.4 | -178.9 | -318.1 | -329.3 | -340.9 | -353.0 | -365.4 |
| Capital Expenditure, % | -4.22 | -2.93 | -2.34 | -2.34 | -1.56 | -2.68 | -2.68 | -2.68 | -2.68 | -2.68 |
| Tax Rate, % | 25.85 | 25.85 | 25.85 | 25.85 | 25.85 | 25.85 | 25.85 | 25.85 | 25.85 | 25.85 |
| EBITAT | 515.0 | 610.8 | 585.9 | 639.5 | 745.1 | 843.6 | 873.4 | 904.2 | 936.1 | 969.2 |
| Depreciation | ||||||||||
| Changes in Account Receivables | ||||||||||
| Changes in Inventories | ||||||||||
| Changes in Accounts Payable | ||||||||||
| Capital Expenditure | ||||||||||
| UFCF | -1,082.3 | 193.2 | 653.5 | 495.0 | -246.9 | 1,208.7 | 822.2 | 851.2 | 881.3 | 912.4 |
| WACC, % | 5.25 | 5.26 | 5.26 | 5.26 | 5.23 | 5.25 | 5.25 | 5.25 | 5.25 | 5.25 |
| PV UFCF | ||||||||||
| SUM PV UFCF | 4,045.1 | |||||||||
| Long Term Growth Rate, % | 1.00 | |||||||||
| Free cash flow (T + 1) | 921 | |||||||||
| Terminal Value | 21,675 | |||||||||
| Present Terminal Value | 16,782 | |||||||||
| Enterprise Value | 20,827 | |||||||||
| Net Debt | -3,345 | |||||||||
| Equity Value | 24,172 | |||||||||
| Diluted Shares Outstanding, MM | 1,043 | |||||||||
| Equity Value Per Share | 23.17 |
What You Will Receive
- Authentic 600987SS Financial Data: Consists of historical and projected data for precise valuation.
- Customizable Parameters: Tailor WACC, tax rates, revenue growth, and capital expenditures to fit your analysis.
- Automated Calculations: Intrinsic value and NPV are computed in real-time.
- Scenario Testing: Evaluate various scenarios to assess Zhejiang Hangmin Co., Ltd’s future performance.
- User-Friendly Design: Designed for professionals while remaining approachable for novices.
Key Features of Zhejiang Hangmin Co., Ltd (600987SS)
- Comprehensive Financial Data: Gain access to reliable historical figures and future forecasts.
- Flexible Forecast Parameters: Modify highlighted fields to adjust WACC, growth rates, and profit margins.
- Automated Calculations: Enjoy real-time updates on DCF, Net Present Value (NPV), and cash flow metrics.
- User-Friendly Dashboard: View your valuation outcomes through clear charts and summaries.
- Suitable for All Users: Designed for investors, CFOs, and consultants alike, with a straightforward interface.
How It Functions
- Download: Obtain the pre-formatted Excel spreadsheet containing Zhejiang Hangmin Co., Ltd's (600987SS) financial data.
- Customize: Tailor forecasts based on your needs, such as revenue growth, EBITDA percentage, and WACC.
- Update Automatically: Watch as intrinsic value and NPV calculations refresh in real-time.
- Test Scenarios: Develop various projections and instantly evaluate different outcomes.
- Make Decisions: Leverage the valuation insights to inform your investment approach.
Why Opt for This Calculator?
- User-Friendly: Tailored for both novices and seasoned professionals.
- Customizable Inputs: Easily adjust parameters to suit your assessment needs.
- Real-Time Feedback: Witness immediate changes to Zhejiang Hangmin Co., Ltd’s valuation as you modify inputs.
- Preconfigured Data: Comes loaded with Zhejiang Hangmin Co., Ltd’s actual financial figures for swift evaluations.
- Endorsed by Experts: Utilized by investors and analysts for making well-informed investment choices.
Who Can Benefit from Zhejiang Hangmin Co., Ltd (600987SS)?
- Investors: Empower your investment choices with a reliable valuation tool designed for precision.
- Financial Analysts: Streamline your workflow with a customizable DCF model readily available for your needs.
- Consultants: Effortlessly modify the template to create impactful presentations or reports for your clients.
- Finance Enthusiasts: Enhance your understanding of valuation methods through practical, real-world examples.
- Educators and Students: Utilize this resource as an effective learning aid in finance curricula.
Contents of the Template
- Pre-Filled Data: Contains historical financials and forecasts for Zhejiang Hangmin Co., Ltd (600987SS).
- Discounted Cash Flow Model: An editable DCF valuation model with automatic calculations included.
- Weighted Average Cost of Capital (WACC): A specific sheet for computing WACC based on your customized inputs.
- Key Financial Ratios: Evaluate Zhejiang Hangmin’s profitability, efficiency, and leverage metrics.
- Customizable Inputs: Easily modify revenue growth, margins, and tax rates.
- Intuitive Dashboard: Visuals and tables that summarize important valuation outcomes.
Disclaimer
All information, articles, and product details provided on this website are for general informational and educational purposes only. We do not claim any ownership over, nor do we intend to infringe upon, any trademarks, copyrights, logos, brand names, or other intellectual property mentioned or depicted on this site. Such intellectual property remains the property of its respective owners, and any references here are made solely for identification or informational purposes, without implying any affiliation, endorsement, or partnership.
We make no representations or warranties, express or implied, regarding the accuracy, completeness, or suitability of any content or products presented. Nothing on this website should be construed as legal, tax, investment, financial, medical, or other professional advice. In addition, no part of this site—including articles or product references—constitutes a solicitation, recommendation, endorsement, advertisement, or offer to buy or sell any securities, franchises, or other financial instruments, particularly in jurisdictions where such activity would be unlawful.
All content is of a general nature and may not address the specific circumstances of any individual or entity. It is not a substitute for professional advice or services. Any actions you take based on the information provided here are strictly at your own risk. You accept full responsibility for any decisions or outcomes arising from your use of this website and agree to release us from any liability in connection with your use of, or reliance upon, the content or products found herein.