
|
Ningxia Baofeng Energy Group Co., Ltd. (600989.SS) Avaliação DCF |
Totalmente Editável: Adapte-Se Às Suas Necessidades No Excel Ou Planilhas
Design Profissional: Modelos Confiáveis E Padrão Da Indústria
Pré-Construídos Para Uso Rápido E Eficiente
Compatível com MAC/PC, totalmente desbloqueado
Não É Necessária Experiência; Fácil De Seguir
Ningxia Baofeng Energy Group Co., Ltd. (600989.SS) Bundle
Avalie as perspectivas financeiras da Ningxia Baofeng Energy Group Co., Ltd. como um especialista! Esta calculadora (600989SS) DCF vem com finanças pré-preenchidas e oferece a flexibilidade para modificar o crescimento da receita, o WACC, as margens e outras suposições cruciais para se alinhar com suas projeções.
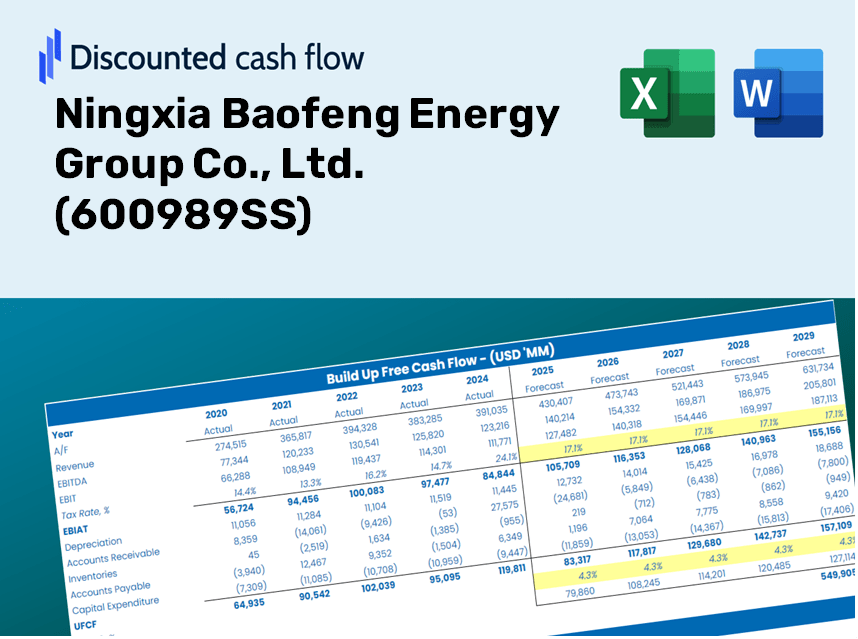
Discounted Cash Flow (DCF) - (USD MM)
| Year | AY1 2020 |
AY2 2021 |
AY3 2022 |
AY4 2023 |
AY5 2024 |
FY1 2025 |
FY2 2026 |
FY3 2027 |
FY4 2028 |
FY5 2029 |
|---|---|---|---|---|---|---|---|---|---|---|
| Revenue | 15,927.7 | 23,299.9 | 28,429.8 | 29,135.5 | 32,982.9 | 39,908.4 | 48,288.1 | 58,427.4 | 70,695.6 | 85,539.8 |
| Revenue Growth, % | 0 | 46.29 | 22.02 | 2.48 | 13.21 | 21 | 21 | 21 | 21 | 21 |
| EBITDA | 6,701.1 | 10,008.4 | 9,021.6 | 8,595.9 | 10,156.3 | 14,132.0 | 17,099.3 | 20,689.7 | 25,034.0 | 30,290.5 |
| EBITDA, % | 42.07 | 42.95 | 31.73 | 29.5 | 30.79 | 35.41 | 35.41 | 35.41 | 35.41 | 35.41 |
| Depreciation | 1,107.1 | 1,317.6 | 1,454.2 | 1,822.8 | 2,157.2 | 2,435.8 | 2,947.3 | 3,566.1 | 4,314.9 | 5,220.9 |
| Depreciation, % | 6.95 | 5.66 | 5.11 | 6.26 | 6.54 | 6.1 | 6.1 | 6.1 | 6.1 | 6.1 |
| EBIT | 5,594.0 | 8,690.8 | 7,567.4 | 6,773.1 | 7,999.0 | 11,696.2 | 14,152.1 | 17,123.6 | 20,719.1 | 25,069.6 |
| EBIT, % | 35.12 | 37.3 | 26.62 | 23.25 | 24.25 | 29.31 | 29.31 | 29.31 | 29.31 | 29.31 |
| Total Cash | 3,087.4 | 1,450.7 | 2,158.0 | 1,283.4 | 2,477.0 | 3,601.0 | 4,357.1 | 5,272.0 | 6,379.0 | 7,718.4 |
| Total Cash, percent | .0 | .0 | .0 | .0 | .0 | .0 | .0 | .0 | .0 | .0 |
| Account Receivables | 408.5 | 418.5 | 221.0 | 76.2 | 120.2 | 460.1 | 556.7 | 673.6 | 815.0 | 986.1 |
| Account Receivables, % | 2.56 | 1.8 | 0.77725 | 0.26169 | 0.36434 | 1.15 | 1.15 | 1.15 | 1.15 | 1.15 |
| Inventories | 803.3 | 940.4 | 1,347.7 | 1,292.2 | 1,575.2 | 1,838.2 | 2,224.2 | 2,691.2 | 3,256.3 | 3,940.1 |
| Inventories, % | 5.04 | 4.04 | 4.74 | 4.43 | 4.78 | 4.61 | 4.61 | 4.61 | 4.61 | 4.61 |
| Accounts Payable | 767.9 | 894.2 | 1,678.0 | 1,948.3 | 1,489.2 | 2,056.4 | 2,488.1 | 3,010.6 | 3,642.7 | 4,407.6 |
| Accounts Payable, % | 4.82 | 3.84 | 5.9 | 6.69 | 4.51 | 5.15 | 5.15 | 5.15 | 5.15 | 5.15 |
| Capital Expenditure | -2,573.9 | -5,357.2 | -9,977.2 | -12,842.2 | -11,529.1 | -12,234.2 | -14,803.1 | -17,911.3 | -21,672.2 | -26,222.8 |
| Capital Expenditure, % | -16.16 | -22.99 | -35.09 | -44.08 | -34.95 | -30.66 | -30.66 | -30.66 | -30.66 | -30.66 |
| Tax Rate, % | 13.02 | 13.02 | 13.02 | 13.02 | 13.02 | 13.02 | 13.02 | 13.02 | 13.02 | 13.02 |
| EBITAT | 4,926.9 | 7,566.8 | 6,526.8 | 5,918.3 | 6,957.6 | 10,193.2 | 12,333.5 | 14,923.2 | 18,056.7 | 21,848.1 |
| Depreciation | ||||||||||
| Changes in Account Receivables | ||||||||||
| Changes in Inventories | ||||||||||
| Changes in Accounts Payable | ||||||||||
| Capital Expenditure | ||||||||||
| UFCF | 3,016.2 | 3,506.4 | -1,422.2 | -4,630.6 | -3,200.4 | 359.0 | 426.9 | 516.5 | 625.0 | 756.2 |
| WACC, % | 6.78 | 6.77 | 6.76 | 6.77 | 6.77 | 6.77 | 6.77 | 6.77 | 6.77 | 6.77 |
| PV UFCF | ||||||||||
| SUM PV UFCF | 2,161.1 | |||||||||
| Long Term Growth Rate, % | 3.50 | |||||||||
| Free cash flow (T + 1) | 783 | |||||||||
| Terminal Value | 23,931 | |||||||||
| Present Terminal Value | 17,247 | |||||||||
| Enterprise Value | 19,408 | |||||||||
| Net Debt | 22,217 | |||||||||
| Equity Value | -2,809 | |||||||||
| Diluted Shares Outstanding, MM | 7,285 | |||||||||
| Equity Value Per Share | -0.39 |
What You Will Receive
- Authentic 600989SS Financial Data: Access to both historical and projected figures for precise valuation.
- Customizable Parameters: Adjust factors like WACC, tax rates, revenue growth, and capital investments.
- Real-Time Calculations: Intrinsic value and NPV are computed automatically.
- Scenario Simulation: Evaluate various scenarios to assess Ningxia Baofeng Energy Group's future performance.
- User-Friendly Interface: Designed for professionals while remaining easy to navigate for newcomers.
Key Features
- Customizable Forecast Inputs: Adjust essential metrics such as revenue growth, EBITDA %, and capital expenditures.
- Instant DCF Valuation: Quickly computes intrinsic value, NPV, and other financial metrics.
- High-Precision Accuracy: Utilizes Ningxia Baofeng Energy Group Co., Ltd.'s (600989SS) actual financial data for dependable valuation results.
- Streamlined Scenario Analysis: Effortlessly explore various assumptions and evaluate their impacts.
- Efficiency-Boosting Tool: Avoid the complexities of creating detailed valuation models from the ground up.
How It Functions
- Download: Obtain the pre-formulated Excel file featuring Ningxia Baofeng Energy Group Co., Ltd.'s (600989SS) financial data.
- Customize: Tailor forecasts such as revenue growth, EBITDA %, and WACC to fit your analysis.
- Update Automatically: Experience real-time updates for intrinsic value and NPV calculations.
- Test Scenarios: Generate various projections and instantly compare their outcomes.
- Make Decisions: Leverage valuation insights to inform your investment strategy.
Why Choose Ningxia Baofeng Energy Group Co., Ltd. (600989SS) Calculator?
- Time-Saving: Get started instantly with a pre-built DCF model tailored for your needs.
- Enhanced Accuracy: Dependable financial data and formulas help minimize valuation errors.
- Fully Adaptable: Adjust the model to align with your specific assumptions and forecasts.
- User-Friendly: Intuitive charts and outputs make interpreting results straightforward.
- Preferred by Professionals: Crafted for experts who prioritize accuracy and functionality.
Who Can Benefit from This Product?
- Finance Students: Master valuation methods and practice them with real-world data related to Ningxia Baofeng Energy Group Co., Ltd. (600989SS).
- Researchers: Integrate industry-standard models into your academic work or studies on energy companies.
- Investors: Validate your investment hypotheses and assess valuation scenarios for Ningxia Baofeng Energy Group Co., Ltd. (600989SS).
- Market Analysts: Enhance your analysis process with a customizable, ready-to-use DCF model tailored for energy sector evaluations.
- Entrepreneurs: Gain a deeper understanding of how large publicly traded companies like Ningxia Baofeng Energy Group Co., Ltd. (600989SS) are valued and analyzed.
Contents of the Template
- Pre-Filled Data: Contains Ningxia Baofeng Energy Group Co., Ltd.'s historical financials and projections.
- Discounted Cash Flow Model: Editable DCF valuation model with automatic calculations included.
- Weighted Average Cost of Capital (WACC): A specific sheet designed for calculating WACC using custom inputs.
- Key Financial Ratios: Evaluate Ningxia Baofeng’s profitability, operational efficiency, and financial leverage.
- Customizable Inputs: Easily modify revenue growth rates, profit margins, and tax rates.
- Clear Dashboard: Visual representations and tables summarizing essential valuation results.
Disclaimer
All information, articles, and product details provided on this website are for general informational and educational purposes only. We do not claim any ownership over, nor do we intend to infringe upon, any trademarks, copyrights, logos, brand names, or other intellectual property mentioned or depicted on this site. Such intellectual property remains the property of its respective owners, and any references here are made solely for identification or informational purposes, without implying any affiliation, endorsement, or partnership.
We make no representations or warranties, express or implied, regarding the accuracy, completeness, or suitability of any content or products presented. Nothing on this website should be construed as legal, tax, investment, financial, medical, or other professional advice. In addition, no part of this site—including articles or product references—constitutes a solicitation, recommendation, endorsement, advertisement, or offer to buy or sell any securities, franchises, or other financial instruments, particularly in jurisdictions where such activity would be unlawful.
All content is of a general nature and may not address the specific circumstances of any individual or entity. It is not a substitute for professional advice or services. Any actions you take based on the information provided here are strictly at your own risk. You accept full responsibility for any decisions or outcomes arising from your use of this website and agree to release us from any liability in connection with your use of, or reliance upon, the content or products found herein.