
|
Baotailong New Materials Co., Ltd. (601011.SS) Avaliação DCF |
Totalmente Editável: Adapte-Se Às Suas Necessidades No Excel Ou Planilhas
Design Profissional: Modelos Confiáveis E Padrão Da Indústria
Pré-Construídos Para Uso Rápido E Eficiente
Compatível com MAC/PC, totalmente desbloqueado
Não É Necessária Experiência; Fácil De Seguir
Baotailong New Materials Co., Ltd. (601011.SS) Bundle
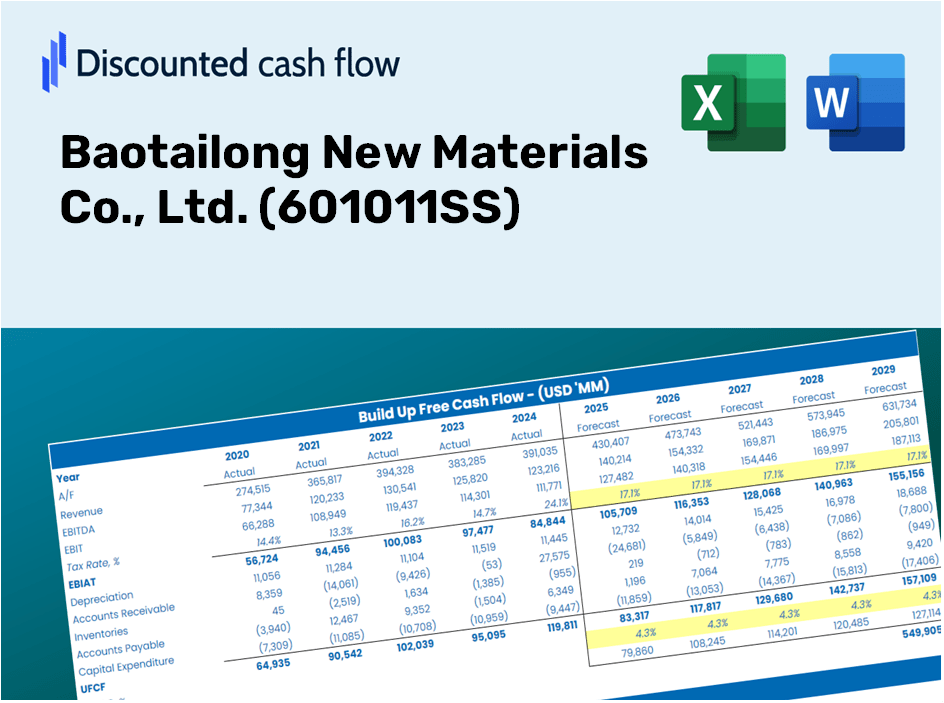
Projetado para precisão, nossa calculadora DCF (601011SS) permite avaliar a avaliação da Baotailong New Materials Co., Ltd. usando dados financeiros do mundo real, oferecendo a flexibilidade para modificar todos os parâmetros essenciais para melhorar as projeções.
Discounted Cash Flow (DCF) - (USD MM)
| Year | AY1 2020 |
AY2 2021 |
AY3 2022 |
AY4 2023 |
AY5 2024 |
FY1 2025 |
FY2 2026 |
FY3 2027 |
FY4 2028 |
FY5 2029 |
|---|---|---|---|---|---|---|---|---|---|---|
| Revenue | 2,674.7 | 3,578.6 | 3,772.9 | 3,680.4 | 1,290.8 | 1,355.4 | 1,423.1 | 1,494.3 | 1,569.0 | 1,647.5 |
| Revenue Growth, % | 0 | 33.79 | 5.43 | -2.45 | -64.93 | 5 | 5 | 5 | 5 | 5 |
| EBITDA | 398.7 | 497.0 | 475.8 | -1,948.6 | -407.3 | -116.8 | -122.6 | -128.8 | -135.2 | -142.0 |
| EBITDA, % | 14.9 | 13.89 | 12.61 | -52.94 | -31.55 | -8.62 | -8.62 | -8.62 | -8.62 | -8.62 |
| Depreciation | 255.8 | 200.1 | 179.4 | 128.5 | 126.7 | 90.0 | 94.5 | 99.3 | 104.2 | 109.4 |
| Depreciation, % | 9.56 | 5.59 | 4.76 | 3.49 | 9.81 | 6.64 | 6.64 | 6.64 | 6.64 | 6.64 |
| EBIT | 142.9 | 296.9 | 296.4 | -2,077.0 | -533.9 | -206.8 | -217.2 | -228.0 | -239.4 | -251.4 |
| EBIT, % | 5.34 | 8.3 | 7.85 | -56.43 | -41.36 | -15.26 | -15.26 | -15.26 | -15.26 | -15.26 |
| Total Cash | 158.1 | 226.1 | 204.7 | 290.7 | 81.9 | 86.5 | 90.8 | 95.3 | 100.1 | 105.1 |
| Total Cash, percent | .0 | .0 | .0 | .0 | .0 | .0 | .0 | .0 | .0 | .0 |
| Account Receivables | 91.4 | 144.9 | 189.7 | 529.7 | 95.5 | 92.9 | 97.6 | 102.5 | 107.6 | 113.0 |
| Account Receivables, % | 3.42 | 4.05 | 5.03 | 14.39 | 7.4 | 6.86 | 6.86 | 6.86 | 6.86 | 6.86 |
| Inventories | 1,177.9 | 1,076.3 | 1,524.0 | 709.7 | 212.7 | 407.3 | 427.7 | 449.1 | 471.5 | 495.1 |
| Inventories, % | 44.04 | 30.08 | 40.39 | 19.28 | 16.48 | 30.05 | 30.05 | 30.05 | 30.05 | 30.05 |
| Accounts Payable | 1,289.1 | 1,360.2 | 1,429.6 | 1,549.2 | 1,566.2 | 721.6 | 757.6 | 795.5 | 835.3 | 877.1 |
| Accounts Payable, % | 48.2 | 38.01 | 37.89 | 42.09 | 121.34 | 53.24 | 53.24 | 53.24 | 53.24 | 53.24 |
| Capital Expenditure | -329.7 | -441.9 | -987.0 | -958.7 | -398.5 | -292.1 | -306.7 | -322.0 | -338.1 | -355.0 |
| Capital Expenditure, % | -12.33 | -12.35 | -26.16 | -26.05 | -30.87 | -21.55 | -21.55 | -21.55 | -21.55 | -21.55 |
| Tax Rate, % | 30.7 | 30.7 | 30.7 | 30.7 | 30.7 | 30.7 | 30.7 | 30.7 | 30.7 | 30.7 |
| EBITAT | 106.0 | 215.0 | 232.2 | -1,457.7 | -370.0 | -150.7 | -158.3 | -166.2 | -174.5 | -183.2 |
| Depreciation | ||||||||||
| Changes in Account Receivables | ||||||||||
| Changes in Inventories | ||||||||||
| Changes in Accounts Payable | ||||||||||
| Capital Expenditure | ||||||||||
| UFCF | 51.9 | 92.3 | -998.3 | -1,694.1 | 306.3 | -1,389.5 | -359.4 | -377.4 | -396.2 | -416.0 |
| WACC, % | 6.72 | 6.7 | 6.79 | 6.67 | 6.65 | 6.71 | 6.71 | 6.71 | 6.71 | 6.71 |
| PV UFCF | ||||||||||
| SUM PV UFCF | -2,534.8 | |||||||||
| Long Term Growth Rate, % | 2.00 | |||||||||
| Free cash flow (T + 1) | -424 | |||||||||
| Terminal Value | -9,018 | |||||||||
| Present Terminal Value | -6,519 | |||||||||
| Enterprise Value | -9,054 | |||||||||
| Net Debt | 1,226 | |||||||||
| Equity Value | -10,280 | |||||||||
| Diluted Shares Outstanding, MM | 1,934 | |||||||||
| Equity Value Per Share | -5.32 |
Benefits You Will Receive
- Authentic BL New Materials Financial Data: Pre-populated with Baotailong’s historical and forecasted figures for accurate analysis.
- Customizable Template: Easily adjust key metrics such as revenue growth, WACC, and EBITDA percentage.
- Instant Calculations: Watch as Baotailong’s intrinsic value recalibrates in real-time with your inputs.
- Expert Valuation Tool: Created for investors, analysts, and consultants pursuing reliable DCF outcomes.
- Intuitive Design: User-friendly layout and straightforward instructions suitable for all experience levels.
Key Features
- 🔍 Real-Life (601011SS) Financials: Pre-loaded historical and projected financial data for Baotailong New Materials Co., Ltd.
- ✏️ Fully Customizable Inputs: Modify all essential parameters (yellow cells) such as WACC, growth %, and tax rates.
- 📊 Professional DCF Valuation: Integrated formulas to calculate the intrinsic value of Baotailong using the Discounted Cash Flow method.
- ⚡ Instant Results: Get immediate visual feedback on Baotailong's valuation after making adjustments.
- Scenario Analysis: Evaluate and compare different financial scenarios side-by-side.
How It Works
- Step 1: Download the Excel file for Baotailong New Materials Co., Ltd. (601011SS).
- Step 2: Review the pre-filled financial data and forecasts for Baotailong.
- Step 3: Adjust key inputs such as revenue growth, WACC, and tax rates (highlighted cells).
- Step 4: Observe the DCF model update in real time as you change your assumptions.
- Step 5: Analyze the results and utilize them for your investment strategies.
Why Select This Calculator for Baotailong New Materials Co., Ltd. (601011SS)?
- Designed for Experts: A sophisticated tool tailored for analysts, CFOs, and consultants.
- Accurate Data: Preloaded financial data for Baotailong New Materials ensures reliable analyses.
- Forecast Simulation: Effortlessly test various scenarios and assumptions.
- Concise Results: Automatically generates intrinsic value, NPV, and essential metrics.
- User-Friendly: Step-by-step guidance simplifies the navigation process.
Who Should Utilize This Product?
- Investors: Effectively assess the fair value of Baotailong New Materials Co., Ltd. (601011SS) prior to making investment choices.
- CFOs: Utilize a professional-grade DCF model for precise financial reporting and analysis.
- Consultants: Efficiently customize the template for client valuation reports.
- Entrepreneurs: Acquire insights into the financial modeling practices employed by leading companies.
- Educators: Employ it as a resource for teaching valuation methodologies.
Contents of the Template
- Detailed DCF Model: An editable template featuring comprehensive valuation calculations.
- Industry-Specific Data: Historical and projected financials for Baotailong New Materials Co., Ltd. (601011SS) included for thorough analysis.
- Flexible Parameters: Modify WACC, growth rates, and tax assumptions to explore different scenarios.
- Financial Statements: Complete annual and quarterly reports for enhanced insights.
- Essential Ratios: Integrated analysis for evaluating profitability, efficiency, and leverage.
- Visual Dashboard: Charts and tables that present clear and actionable results.
Disclaimer
All information, articles, and product details provided on this website are for general informational and educational purposes only. We do not claim any ownership over, nor do we intend to infringe upon, any trademarks, copyrights, logos, brand names, or other intellectual property mentioned or depicted on this site. Such intellectual property remains the property of its respective owners, and any references here are made solely for identification or informational purposes, without implying any affiliation, endorsement, or partnership.
We make no representations or warranties, express or implied, regarding the accuracy, completeness, or suitability of any content or products presented. Nothing on this website should be construed as legal, tax, investment, financial, medical, or other professional advice. In addition, no part of this site—including articles or product references—constitutes a solicitation, recommendation, endorsement, advertisement, or offer to buy or sell any securities, franchises, or other financial instruments, particularly in jurisdictions where such activity would be unlawful.
All content is of a general nature and may not address the specific circumstances of any individual or entity. It is not a substitute for professional advice or services. Any actions you take based on the information provided here are strictly at your own risk. You accept full responsibility for any decisions or outcomes arising from your use of this website and agree to release us from any liability in connection with your use of, or reliance upon, the content or products found herein.