
|
Publicação do Sul da China & Media Group Co., Ltd (601098.SS) Avaliação DCF |
Totalmente Editável: Adapte-Se Às Suas Necessidades No Excel Ou Planilhas
Design Profissional: Modelos Confiáveis E Padrão Da Indústria
Pré-Construídos Para Uso Rápido E Eficiente
Compatível com MAC/PC, totalmente desbloqueado
Não É Necessária Experiência; Fácil De Seguir
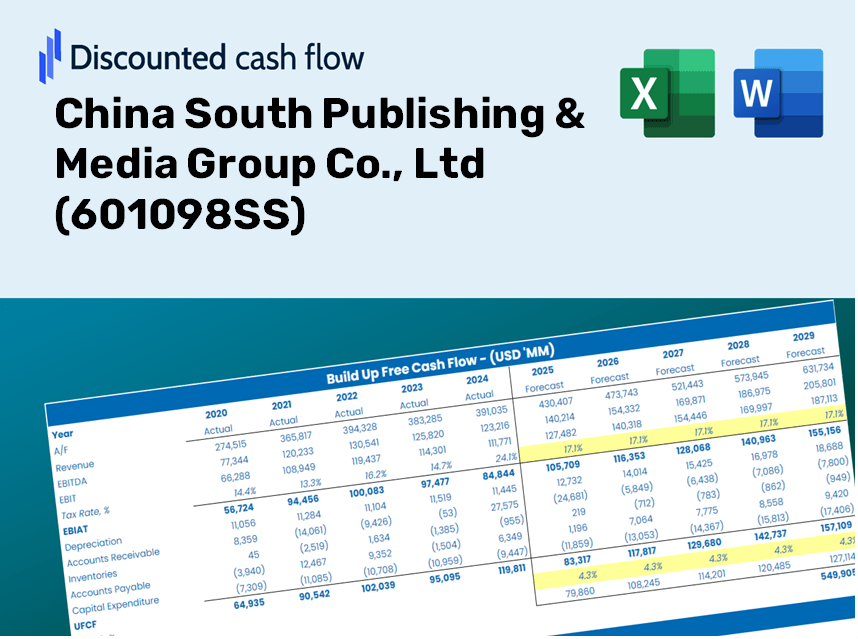
China South Publishing & Media Group Co., Ltd (601098.SS) Bundle
Maximize a eficiência e melhore a precisão com nossa calculadora DCF (601098SS)! Utilizando dados autênticos da China South Publishing & Media Group Co., LTD e suposições personalizáveis, essa ferramenta o capacita a prever, analisar e valorizar (601098Ss) como um investidor experiente.
What You Will Receive
- Authentic CSMG Financial Data: Pre-populated with historical and forecasted figures for accurate analysis.
- Completely Customizable Template: Easily adjust key parameters such as revenue growth, WACC, and EBITDA percentage.
- Real-Time Calculations: Witness immediate updates to CSMG’s intrinsic value based on your modifications.
- Expert Valuation Tool: Tailored for investors, analysts, and consultants focused on precise DCF assessments.
- User-Friendly Interface: Intuitive layout and straightforward guidance suitable for all skill levels.
Key Features
- 🔍 Real-Life (601098SS) Financials: Access pre-filled historical and projected data for China South Publishing & Media Group Co., Ltd.
- ✏️ Fully Customizable Inputs: Tailor all essential parameters (yellow cells) such as WACC, growth %, and tax rates to your needs.
- 📊 Professional DCF Valuation: Utilize built-in formulas to determine the intrinsic value of (601098SS) through the Discounted Cash Flow method.
- ⚡ Instant Results: See the valuation of (601098SS) updated in real-time as you adjust inputs.
- Scenario Analysis: Explore and compare different financial outcomes based on varying assumptions side-by-side.
How It Works
- Download the Template: Gain immediate access to the Excel-based CSMG DCF Calculator for China South Publishing & Media Group Co., Ltd (601098SS).
- Input Your Assumptions: Modify the yellow-highlighted cells to set your growth rates, WACC, profit margins, and other key variables.
- Instant Calculations: The model will promptly recalculate the intrinsic value of China South Publishing & Media Group Co., Ltd (601098SS).
- Test Scenarios: Experiment with various assumptions to see how they impact the valuation outcomes.
- Analyze and Decide: Leverage the findings to inform your investment choices or financial assessments.
Why Opt for This Calculator?
- Precision: Utilizes accurate financial data from China South Publishing & Media Group Co., Ltd (601098SS).
- Versatility: Built to allow users to easily experiment with and adjust inputs.
- Efficiency: Avoid the complexity of constructing a DCF model from the ground up.
- High-Quality: Crafted with the expertise and usability typically expected at the CFO level.
- Accessible: Intuitive design makes it user-friendly, even for those without extensive financial modeling skills.
Who Should Use This Product?
- Finance Students: Master valuation techniques and apply them using real-world data relevant to China South Publishing & Media Group Co., Ltd (601098SS).
- Academics: Integrate professional valuation models into your research or teaching curriculum focused on (601098SS).
- Investors: Evaluate your investment hypotheses and analyze the valuation performance of China South Publishing & Media Group Co., Ltd (601098SS).
- Analysts: Enhance your analytical process with a customizable DCF model tailored for (601098SS).
- Small Business Owners: Discover how large corporations like China South Publishing & Media Group Co., Ltd (601098SS) are evaluated in the market.
Components of the Template
- Operating and Balance Sheet Data: Pre-filled historical data and forecasts for China South Publishing & Media Group Co., Ltd (601098SS), including revenue, EBITDA, EBIT, and capital expenditures.
- WACC Calculation: A dedicated sheet for the Weighted Average Cost of Capital (WACC), featuring parameters such as Beta, risk-free rate, and share price.
- DCF Valuation (Unlevered and Levered): Customizable Discounted Cash Flow models illustrating intrinsic value with comprehensive calculations.
- Financial Statements: Pre-loaded annual and quarterly financial statements to facilitate thorough analysis.
- Key Ratios: Includes profitability, leverage, and efficiency ratios for China South Publishing & Media Group Co., Ltd (601098SS).
- Dashboard and Charts: Visual overview of valuation results and assumptions for straightforward analysis.
Disclaimer
All information, articles, and product details provided on this website are for general informational and educational purposes only. We do not claim any ownership over, nor do we intend to infringe upon, any trademarks, copyrights, logos, brand names, or other intellectual property mentioned or depicted on this site. Such intellectual property remains the property of its respective owners, and any references here are made solely for identification or informational purposes, without implying any affiliation, endorsement, or partnership.
We make no representations or warranties, express or implied, regarding the accuracy, completeness, or suitability of any content or products presented. Nothing on this website should be construed as legal, tax, investment, financial, medical, or other professional advice. In addition, no part of this site—including articles or product references—constitutes a solicitation, recommendation, endorsement, advertisement, or offer to buy or sell any securities, franchises, or other financial instruments, particularly in jurisdictions where such activity would be unlawful.
All content is of a general nature and may not address the specific circumstances of any individual or entity. It is not a substitute for professional advice or services. Any actions you take based on the information provided here are strictly at your own risk. You accept full responsibility for any decisions or outcomes arising from your use of this website and agree to release us from any liability in connection with your use of, or reliance upon, the content or products found herein.