
|
Seazen Holdings Co., Ltd (601155.Ss) Avaliação DCF |
Totalmente Editável: Adapte-Se Às Suas Necessidades No Excel Ou Planilhas
Design Profissional: Modelos Confiáveis E Padrão Da Indústria
Pré-Construídos Para Uso Rápido E Eficiente
Compatível com MAC/PC, totalmente desbloqueado
Não É Necessária Experiência; Fácil De Seguir
Seazen Holdings Co., Ltd (601155.SS) Bundle
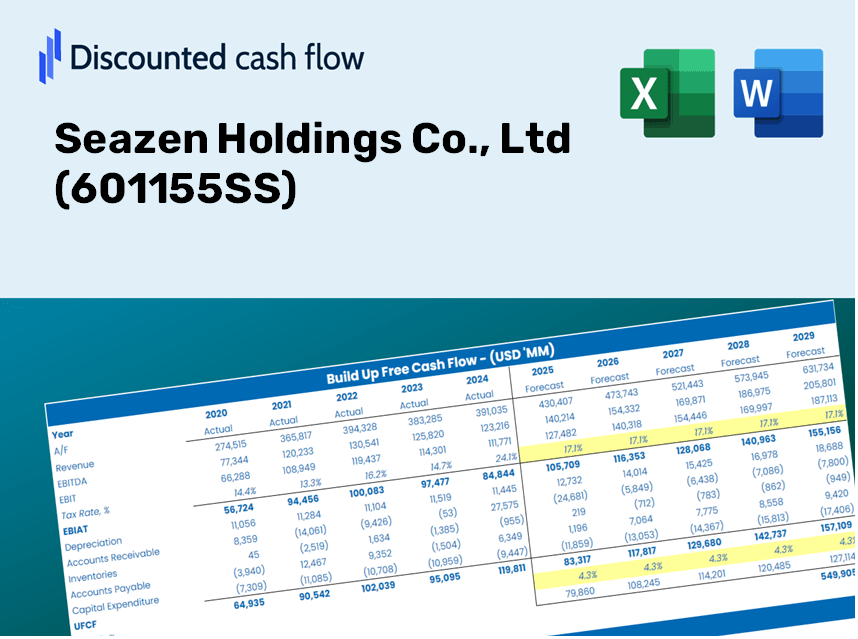
Seja você um investidor ou analista, esta (601155SS) calculadora DCF é o seu recurso preferido para uma avaliação precisa. Pré-carregado com dados reais da Seezen Holdings Co., LTD, você pode ajustar as previsões e observar os efeitos em tempo real.
Discounted Cash Flow (DCF) - (USD MM)
| Year | AY1 2020 |
AY2 2021 |
AY3 2022 |
AY4 2023 |
AY5 2024 |
FY1 2025 |
FY2 2026 |
FY3 2027 |
FY4 2028 |
FY5 2029 |
|---|---|---|---|---|---|---|---|---|---|---|
| Revenue | 145,475.2 | 168,231.7 | 115,456.7 | 119,174.3 | 88,998.6 | 100,787.9 | 114,138.8 | 129,258.3 | 146,380.7 | 165,771.1 |
| Revenue Growth, % | 0 | 15.64 | -31.37 | 3.22 | -25.32 | 13.25 | 13.25 | 13.25 | 13.25 | 13.25 |
| EBITDA | 17,676.6 | 14,720.5 | 4,596.6 | 6,329.5 | 7,036.2 | 7,679.9 | 8,697.2 | 9,849.3 | 11,154.0 | 12,631.6 |
| EBITDA, % | 12.15 | 8.75 | 3.98 | 5.31 | 7.91 | 7.62 | 7.62 | 7.62 | 7.62 | 7.62 |
| Depreciation | 268.8 | 261.0 | 220.9 | 229.7 | 164.8 | 183.3 | 207.5 | 235.0 | 266.2 | 301.4 |
| Depreciation, % | 0.18479 | 0.15516 | 0.19133 | 0.19273 | 0.18517 | 0.18183 | 0.18183 | 0.18183 | 0.18183 | 0.18183 |
| EBIT | 17,407.8 | 14,459.4 | 4,375.7 | 6,099.8 | 6,871.4 | 7,496.6 | 8,489.7 | 9,614.3 | 10,887.9 | 12,330.1 |
| EBIT, % | 11.97 | 8.59 | 3.79 | 5.12 | 7.72 | 7.44 | 7.44 | 7.44 | 7.44 | 7.44 |
| Total Cash | 61,285.6 | 48,843.7 | 24,134.0 | 13,813.8 | 7,470.6 | 22,586.5 | 25,578.5 | 28,966.7 | 32,803.9 | 37,149.2 |
| Total Cash, percent | .0 | .0 | .0 | .0 | .0 | .0 | .0 | .0 | .0 | .0 |
| Account Receivables | 70,308.8 | 77,126.0 | 61,516.9 | 50,928.9 | 42,366.7 | 47,933.8 | 54,283.4 | 61,474.1 | 69,617.4 | 78,839.3 |
| Account Receivables, % | 48.33 | 45.85 | 53.28 | 42.73 | 47.6 | 47.56 | 47.56 | 47.56 | 47.56 | 47.56 |
| Inventories | 270,616.6 | 250,383.1 | 204,412.7 | 142,531.4 | 97,029.9 | 100,787.9 | 114,138.8 | 129,258.3 | 146,380.7 | 165,771.1 |
| Inventories, % | 186.02 | 148.83 | 177.05 | 119.6 | 109.02 | 100 | 100 | 100 | 100 | 100 |
| Accounts Payable | 58,384.7 | 60,330.4 | 50,576.6 | 48,461.4 | 88,801.7 | 52,458.9 | 59,407.9 | 67,277.5 | 76,189.4 | 86,281.9 |
| Accounts Payable, % | 40.13 | 35.86 | 43.81 | 40.66 | 99.78 | 52.05 | 52.05 | 52.05 | 52.05 | 52.05 |
| Capital Expenditure | -1,206.6 | -1,467.3 | -1,154.6 | -281.2 | -49.4 | -603.3 | -683.3 | -773.8 | -876.3 | -992.3 |
| Capital Expenditure, % | -0.82944 | -0.87221 | -1 | -0.23595 | -0.05545482 | -0.59862 | -0.59862 | -0.59862 | -0.59862 | -0.59862 |
| Tax Rate, % | 74.11 | 74.11 | 74.11 | 74.11 | 74.11 | 74.11 | 74.11 | 74.11 | 74.11 | 74.11 |
| EBITAT | 11,942.9 | 9,944.4 | 1,957.7 | 983.4 | 1,778.8 | 3,360.4 | 3,805.6 | 4,309.7 | 4,880.6 | 5,527.1 |
| Depreciation | ||||||||||
| Changes in Account Receivables | ||||||||||
| Changes in Inventories | ||||||||||
| Changes in Accounts Payable | ||||||||||
| Capital Expenditure | ||||||||||
| UFCF | -271,535.7 | 24,100.0 | 52,849.7 | 71,285.9 | 96,298.4 | -42,727.6 | -9,421.7 | -10,669.7 | -12,083.1 | -13,683.7 |
| WACC, % | 9.19 | 9.2 | 8.79 | 8.3 | 8.46 | 8.79 | 8.79 | 8.79 | 8.79 | 8.79 |
| PV UFCF | ||||||||||
| SUM PV UFCF | -73,131.7 | |||||||||
| Long Term Growth Rate, % | 2.00 | |||||||||
| Free cash flow (T + 1) | -13,957 | |||||||||
| Terminal Value | -205,622 | |||||||||
| Present Terminal Value | -134,948 | |||||||||
| Enterprise Value | -208,080 | |||||||||
| Net Debt | 52,144 | |||||||||
| Equity Value | -260,224 | |||||||||
| Diluted Shares Outstanding, MM | 7,044 | |||||||||
| Equity Value Per Share | -36.94 |
What You Will Receive
- Pre-Populated Financial Model: Utilize Seazen Holdings' actual data for accurate DCF valuation.
- Comprehensive Forecast Flexibility: Modify revenue growth, profit margins, WACC, and other critical factors.
- Real-Time Calculations: Instant updates provide immediate feedback as you make adjustments.
- Professional-Grade Template: A polished Excel file crafted for high-quality valuation presentations.
- Adaptable and Reusable: Designed for versatility, allowing repeated application for in-depth forecasts.
Key Features
- Pre-Loaded Data: Seazen Holdings’ historical financial statements and pre-filled forecasts.
- Fully Adjustable Inputs: Customize WACC, tax rates, revenue growth, and EBITDA margins as needed.
- Instant Results: Watch Seazen Holdings’ intrinsic value update in real time.
- Clear Visual Outputs: Dashboard charts present valuation results and essential metrics.
- Built for Accuracy: A professional-grade tool tailored for analysts, investors, and finance professionals.
How It Functions
- Step 1: Download the prebuilt Excel template containing Seazen Holdings Co., Ltd's (601155SS) data.
- Step 2: Navigate through the populated sheets to familiarize yourself with the essential metrics.
- Step 3: Modify forecasts and assumptions in the editable yellow cells (WACC, growth, margins).
- Step 4: Instantly view updated results, including the intrinsic value of Seazen Holdings Co., Ltd (601155SS).
- Step 5: Utilize the outputs to make informed investment decisions or generate comprehensive reports.
Why Choose This Calculator for Seazen Holdings Co., Ltd (601155SS)?
- Precision: Utilize real financial data from Seazen for guaranteed accuracy.
- Versatility: Users can easily adjust and test different input values to suit their needs.
- Efficiency: Avoid the complexities of building a DCF model from the ground up.
- High-Quality: Crafted with the expertise and attention to detail expected at the CFO level.
- Accessible: Designed for simplicity, making it suitable for users of all financial backgrounds.
Who Can Benefit from Seazen Holdings Co., Ltd (601155SS)?
- Investors: Make informed choices with a sophisticated valuation tool tailored for Seazen Holdings.
- Financial Analysts: Streamline your workflow with a customizable DCF model designed specifically for (601155SS).
- Consultants: Effortlessly modify the template for impactful client presentations and reports related to Seazen Holdings.
- Finance Enthusiasts: Enhance your grasp of valuation methods through practical applications involving (601155SS).
- Educators and Students: Employ this resource as a hands-on learning aid in finance and investment courses focused on Seazen Holdings.
Contents of the Template
- Preloaded 601155SS Data: Historical and projected financial information, including revenue, EBIT, and capital investments.
- DCF and WACC Models: Professional-grade spreadsheets for determining intrinsic value and Weighted Average Cost of Capital.
- Editable Inputs: Yellow-highlighted cells for modifying revenue growth, tax rates, and discount rates.
- Financial Statements: Detailed annual and quarterly financial reports for in-depth analysis.
- Key Ratios: Metrics for profitability, leverage, and efficiency to assess performance.
- Dashboard and Charts: Visual summaries of valuation results and underlying assumptions.
Disclaimer
All information, articles, and product details provided on this website are for general informational and educational purposes only. We do not claim any ownership over, nor do we intend to infringe upon, any trademarks, copyrights, logos, brand names, or other intellectual property mentioned or depicted on this site. Such intellectual property remains the property of its respective owners, and any references here are made solely for identification or informational purposes, without implying any affiliation, endorsement, or partnership.
We make no representations or warranties, express or implied, regarding the accuracy, completeness, or suitability of any content or products presented. Nothing on this website should be construed as legal, tax, investment, financial, medical, or other professional advice. In addition, no part of this site—including articles or product references—constitutes a solicitation, recommendation, endorsement, advertisement, or offer to buy or sell any securities, franchises, or other financial instruments, particularly in jurisdictions where such activity would be unlawful.
All content is of a general nature and may not address the specific circumstances of any individual or entity. It is not a substitute for professional advice or services. Any actions you take based on the information provided here are strictly at your own risk. You accept full responsibility for any decisions or outcomes arising from your use of this website and agree to release us from any liability in connection with your use of, or reliance upon, the content or products found herein.