
|
Energia Interior da Mongólia Junzheng & Chemical Group Co., Ltd. (601216.SS) Avaliação do DCF |
Totalmente Editável: Adapte-Se Às Suas Necessidades No Excel Ou Planilhas
Design Profissional: Modelos Confiáveis E Padrão Da Indústria
Pré-Construídos Para Uso Rápido E Eficiente
Compatível com MAC/PC, totalmente desbloqueado
Não É Necessária Experiência; Fácil De Seguir
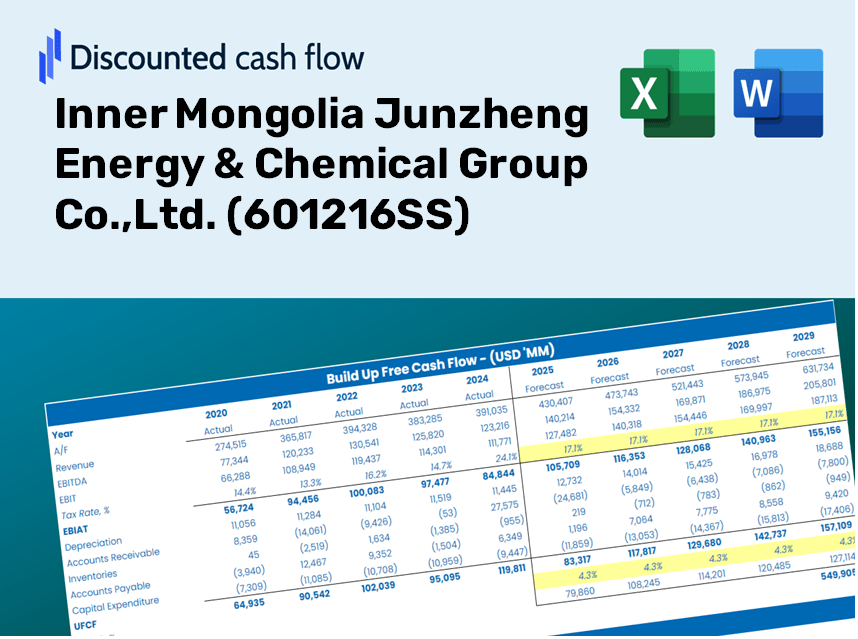
Inner Mongolia Junzheng Energy & Chemical Group Co.,Ltd. (601216.SS) Bundle
Avalie as perspectivas financeiras da Mongólia Interior Junzheng Energy & Chemical Group Co., Ltd. Como um especialista! Esta (601216SS) calculadora DCF fornece dados financeiros pré-preenchidos, juntamente com a flexibilidade para modificar o crescimento da receita, o WACC, as margens e outras suposições essenciais para se alinhar às suas previsões.
Discounted Cash Flow (DCF) - (USD MM)
| Year | AY1 2020 |
AY2 2021 |
AY3 2022 |
AY4 2023 |
AY5 2024 |
FY1 2025 |
FY2 2026 |
FY3 2027 |
FY4 2028 |
FY5 2029 |
|---|---|---|---|---|---|---|---|---|---|---|
| Revenue | 14,803.8 | 19,297.0 | 21,459.7 | 19,124.4 | 25,211.2 | 29,150.6 | 33,705.7 | 38,972.6 | 45,062.4 | 52,103.9 |
| Revenue Growth, % | 0 | 30.35 | 11.21 | -10.88 | 31.83 | 15.63 | 15.63 | 15.63 | 15.63 | 15.63 |
| EBITDA | 4,382.0 | 6,348.3 | 5,453.0 | 3,974.1 | 4,683.8 | 7,419.8 | 8,579.2 | 9,919.8 | 11,469.9 | 13,262.2 |
| EBITDA, % | 29.6 | 32.9 | 25.41 | 20.78 | 18.58 | 25.45 | 25.45 | 25.45 | 25.45 | 25.45 |
| Depreciation | 1,354.7 | 1,279.0 | 1,606.0 | 1,514.4 | 1,893.2 | 2,255.7 | 2,608.2 | 3,015.7 | 3,487.0 | 4,031.9 |
| Depreciation, % | 9.15 | 6.63 | 7.48 | 7.92 | 7.51 | 7.74 | 7.74 | 7.74 | 7.74 | 7.74 |
| EBIT | 3,027.3 | 5,069.3 | 3,847.0 | 2,459.6 | 2,790.6 | 5,164.1 | 5,971.0 | 6,904.1 | 7,982.9 | 9,230.3 |
| EBIT, % | 20.45 | 26.27 | 17.93 | 12.86 | 11.07 | 17.72 | 17.72 | 17.72 | 17.72 | 17.72 |
| Total Cash | 7,699.6 | 7,397.9 | 9,531.4 | 4,194.9 | 4,548.0 | 10,187.4 | 11,779.3 | 13,620.0 | 15,748.2 | 18,209.0 |
| Total Cash, percent | .0 | .0 | .0 | .0 | .0 | .0 | .0 | .0 | .0 | .0 |
| Account Receivables | 1,552.5 | 2,143.9 | 2,202.5 | 1,597.7 | 1,731.9 | 2,745.1 | 3,174.0 | 3,670.0 | 4,243.5 | 4,906.6 |
| Account Receivables, % | 10.49 | 11.11 | 10.26 | 8.35 | 6.87 | 9.42 | 9.42 | 9.42 | 9.42 | 9.42 |
| Inventories | 540.1 | 856.6 | 939.8 | 977.8 | 1,254.5 | 1,315.0 | 1,520.5 | 1,758.1 | 2,032.9 | 2,350.5 |
| Inventories, % | 3.65 | 4.44 | 4.38 | 5.11 | 4.98 | 4.51 | 4.51 | 4.51 | 4.51 | 4.51 |
| Accounts Payable | 1,530.2 | 2,305.1 | 137.7 | 4,878.8 | 4,752.3 | 3,922.8 | 4,535.8 | 5,244.5 | 6,064.1 | 7,011.6 |
| Accounts Payable, % | 10.34 | 11.95 | 0.64179 | 25.51 | 18.85 | 13.46 | 13.46 | 13.46 | 13.46 | 13.46 |
| Capital Expenditure | -379.8 | -607.8 | -951.1 | -2,165.3 | -2,873.9 | -1,916.3 | -2,215.7 | -2,562.0 | -2,962.3 | -3,425.2 |
| Capital Expenditure, % | -2.57 | -3.15 | -4.43 | -11.32 | -11.4 | -6.57 | -6.57 | -6.57 | -6.57 | -6.57 |
| Tax Rate, % | 12.14 | 12.14 | 12.14 | 12.14 | 12.14 | 12.14 | 12.14 | 12.14 | 12.14 | 12.14 |
| EBITAT | 2,484.3 | 4,244.4 | 3,231.3 | 2,161.3 | 2,451.8 | 4,394.8 | 5,081.5 | 5,875.5 | 6,793.6 | 7,855.2 |
| Depreciation | ||||||||||
| Changes in Account Receivables | ||||||||||
| Changes in Inventories | ||||||||||
| Changes in Accounts Payable | ||||||||||
| Capital Expenditure | ||||||||||
| UFCF | 2,896.7 | 4,782.7 | 1,576.9 | 6,818.3 | 933.7 | 2,831.0 | 5,452.5 | 6,304.5 | 7,289.7 | 8,428.7 |
| WACC, % | 4.71 | 4.72 | 4.72 | 4.74 | 4.74 | 4.72 | 4.72 | 4.72 | 4.72 | 4.72 |
| PV UFCF | ||||||||||
| SUM PV UFCF | 25,916.3 | |||||||||
| Long Term Growth Rate, % | 2.00 | |||||||||
| Free cash flow (T + 1) | 8,597 | |||||||||
| Terminal Value | 315,583 | |||||||||
| Present Terminal Value | 250,540 | |||||||||
| Enterprise Value | 276,456 | |||||||||
| Net Debt | 2,449 | |||||||||
| Equity Value | 274,007 | |||||||||
| Diluted Shares Outstanding, MM | 8,438 | |||||||||
| Equity Value Per Share | 32.47 |
What You Will Receive
- Authentic (601216SS) Financial Data: Access to both historical and projected figures for precise valuation.
- Customizable Parameters: Adjust WACC, tax rates, revenue growth, and capital expenditures as needed.
- Automatic Calculations: Intrinsic value and NPV are computed in real-time.
- Scenario Analysis: Explore various scenarios to assess the future performance of Inner Mongolia Junzheng Energy & Chemical Group Co., Ltd.
- User-Friendly Design: Designed for professionals while remaining accessible to newcomers.
Highlighted Features
- Authentic (601216SS) Data: Pre-loaded with the historical financials and projected figures for Inner Mongolia Junzheng Energy & Chemical Group Co., Ltd.
- Completely Customizable Variables: Modify revenue growth rates, profit margins, WACC, taxation, and capital investments as per your requirements.
- Interactive Valuation Framework: Real-time adjustments to Net Present Value (NPV) and intrinsic value based on your specified parameters.
- Comprehensive Scenario Analysis: Generate various forecasting scenarios to evaluate different valuation results.
- Intuitive User Interface: Designed to be straightforward and organized, catering to both professionals and novices.
How It Functions
- Step 1: Download the Excel spreadsheet.
- Step 2: Examine the pre-populated financial information and forecasts for Inner Mongolia Junzheng Energy & Chemical Group Co., Ltd. (601216SS).
- Step 3: Adjust key parameters such as revenue growth, WACC, and tax rates (highlighted cells).
- Step 4: Observe the DCF model refresh in real-time as you modify your assumptions.
- Step 5: Evaluate the outputs and leverage the findings for your investment strategies.
Why Opt for This Calculator?
- User-Friendly Design: Perfectly suited for both novices and seasoned professionals.
- Customizable Parameters: Effortlessly adjust inputs to tailor your financial analysis.
- Real-Time Feedback: Witness immediate updates to Inner Mongolia Junzheng Energy & Chemical Group Co.,Ltd.’s valuation as you modify inputs.
- Preconfigured Data: Comes equipped with Inner Mongolia Junzheng's actual financial information for swift evaluations.
- Endorsed by Experts: Trusted by investors and analysts for making well-informed financial choices.
Who Can Benefit from Inner Mongolia Junzheng Energy & Chemical Group Co.,Ltd. (601216SS)?
- Investors: Gain confidence in your investment choices with our comprehensive analysis tools.
- Financial Analysts: Streamline your workflow with customizable DCF models tailored for our industry.
- Consultants: Effortlessly modify reports and presentations to suit your clients' needs.
- Energy Sector Enthusiasts: Enhance your knowledge of energy and chemical markets through real-life case studies.
- Students and Educators: Utilize our resources for hands-on learning in energy and finance disciplines.
Contents of the Template
- Operating and Balance Sheet Data: Pre-filled historical data and forecasts for Inner Mongolia Junzheng Energy & Chemical Group Co., Ltd. (601216SS), including revenue, EBITDA, EBIT, and capital expenditures.
- WACC Calculation: A specific sheet for Weighted Average Cost of Capital (WACC), with key parameters such as Beta, risk-free rate, and share price.
- DCF Valuation (Unlevered and Levered): Customizable Discounted Cash Flow models illustrating intrinsic value alongside detailed calculations.
- Financial Statements: Pre-loaded annual and quarterly financial statements to facilitate thorough analysis.
- Key Ratios: Covers important profitability, leverage, and efficiency ratios for Inner Mongolia Junzheng Energy & Chemical Group Co., Ltd. (601216SS).
- Dashboard and Charts: A visual representation of valuation outputs and underlying assumptions for easier analysis of results.
Disclaimer
All information, articles, and product details provided on this website are for general informational and educational purposes only. We do not claim any ownership over, nor do we intend to infringe upon, any trademarks, copyrights, logos, brand names, or other intellectual property mentioned or depicted on this site. Such intellectual property remains the property of its respective owners, and any references here are made solely for identification or informational purposes, without implying any affiliation, endorsement, or partnership.
We make no representations or warranties, express or implied, regarding the accuracy, completeness, or suitability of any content or products presented. Nothing on this website should be construed as legal, tax, investment, financial, medical, or other professional advice. In addition, no part of this site—including articles or product references—constitutes a solicitation, recommendation, endorsement, advertisement, or offer to buy or sell any securities, franchises, or other financial instruments, particularly in jurisdictions where such activity would be unlawful.
All content is of a general nature and may not address the specific circumstances of any individual or entity. It is not a substitute for professional advice or services. Any actions you take based on the information provided here are strictly at your own risk. You accept full responsibility for any decisions or outcomes arising from your use of this website and agree to release us from any liability in connection with your use of, or reliance upon, the content or products found herein.