
|
Ningxia Jiaze Renowables Corporation Limited (601619.SS) Avaliação DCF |
Totalmente Editável: Adapte-Se Às Suas Necessidades No Excel Ou Planilhas
Design Profissional: Modelos Confiáveis E Padrão Da Indústria
Pré-Construídos Para Uso Rápido E Eficiente
Compatível com MAC/PC, totalmente desbloqueado
Não É Necessária Experiência; Fácil De Seguir
Ningxia Jiaze Renewables Corporation Limited (601619.SS) Bundle
Streamline Ningxia Jiaze Renewables Corporation Limited (601619Ss) Avaliação com esta calculadora DCF personalizável! Equipado com o Ningxia Jiaze Renowables Corporation Limited (601619Ss) e insumos flexíveis de previsão, você pode explorar cenários e determinar o valor justo Ningxia Jiaze Renowables Limited (601619Ss) em apenas minutos.
Benefits You Will Receive
- Authentic (601619SS) Financial Data: Pre-loaded with Ningxia Jiaze Renewables Corporation Limited's historical and forecasted data for accurate analysis.
- Completely Customizable Template: Effortlessly adjust key inputs such as revenue growth, WACC, and EBITDA percentage.
- Instantaneous Calculations: Watch the intrinsic value of (601619SS) update in real time as you make changes.
- Professional Valuation Tool: Crafted for investors, analysts, and consultants who require reliable DCF outcomes.
- User-Friendly Interface: An intuitive layout with straightforward instructions suitable for all skill levels.
Key Features
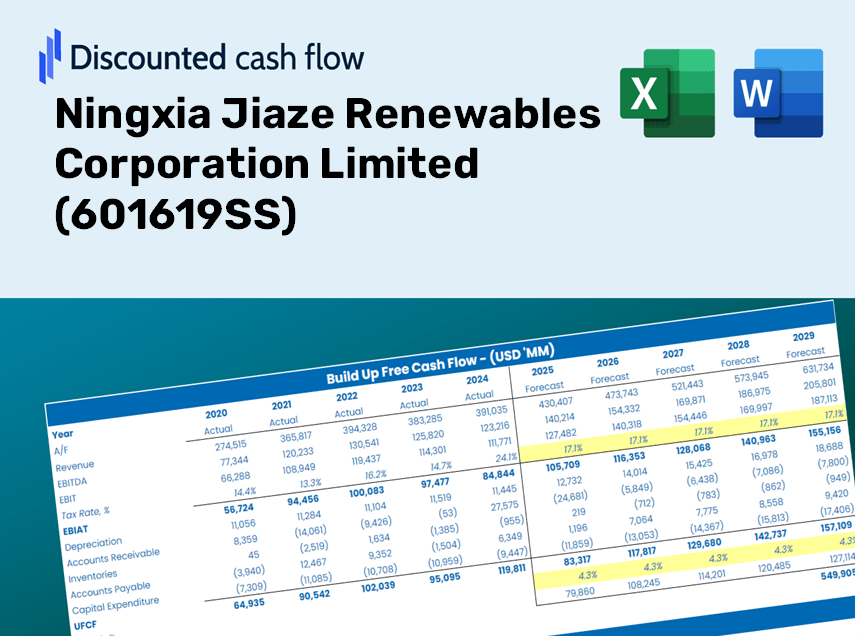
- Pre-Loaded Data: Historical financial statements and pre-filled forecasts for Ningxia Jiaze Renewables Corporation Limited (601619SS).
- Fully Adjustable Inputs: Customize WACC, tax rates, revenue growth, and EBITDA margins to suit your analysis.
- Instant Results: Observe the intrinsic value of Ningxia Jiaze Renewables Corporation Limited (601619SS) recalculating in real time.
- Clear Visual Outputs: Dashboard charts provide a visual representation of valuation results and key metrics.
- Built for Accuracy: A professional-grade tool designed for analysts, investors, and finance professionals.
How It Functions
- Obtain the Template: Gain immediate access to the Excel-based Ningxia Jiaze Renewables Corporation Limited (601619SS) DCF Calculator.
- Enter Your Assumptions: Modify the yellow-highlighted cells for growth rates, WACC, margins, and additional parameters.
- Automatic Calculations: The model promptly recalculates Ningxia Jiaze’s intrinsic value.
- Explore Scenarios: Test various assumptions to assess possible changes in valuation.
- Review and Conclude: Utilize the findings to inform your investment or financial analysis.
Why Choose This Calculator for Ningxia Jiaze Renewables Corporation Limited (601619SS)?
- All-in-One Solution: Combines DCF, WACC, and financial ratio analyses for comprehensive evaluation.
- Flexible Input Options: Modify the yellow-highlighted cells to explore different financial scenarios.
- In-Depth Analysis: Automatically computes the intrinsic value and Net Present Value for Ningxia Jiaze Renewables.
- Pre-Configured Data: Features both historical and projected data for reliable analysis.
- High-Quality Standards: Perfect for financial analysts, investors, and business consultants focused on (601619SS).
Who Can Benefit from Our Product?
- Investors: Enhance your investment strategies with a cutting-edge valuation tool tailored for [601619SS].
- Financial Analysts: Streamline your workflow with a customizable DCF model specifically designed for [601619SS].
- Consultants: Efficiently modify the template for impactful presentations or reports focused on [601619SS].
- Finance Enthusiasts: Expand your knowledge of valuation methods through practical, real-world examples related to [601619SS].
- Educators and Students: Utilize the tool as a hands-on resource in finance courses centered around [601619SS].
Contents of the Template
- Preloaded NJRC Data: Historical and projected financial metrics, including revenue, EBIT, and capital expenditures.
- DCF and WACC Models: Advanced worksheets for determining intrinsic value and the Weighted Average Cost of Capital.
- Editable Inputs: Cells highlighted in yellow for customizing revenue growth, tax rates, and discount rates.
- Financial Statements: Detailed annual and quarterly financials for in-depth analysis.
- Key Ratios: Profitability, leverage, and efficiency metrics to assess performance.
- Dashboard and Charts: Visual representations of valuation results and underlying assumptions.
Disclaimer
All information, articles, and product details provided on this website are for general informational and educational purposes only. We do not claim any ownership over, nor do we intend to infringe upon, any trademarks, copyrights, logos, brand names, or other intellectual property mentioned or depicted on this site. Such intellectual property remains the property of its respective owners, and any references here are made solely for identification or informational purposes, without implying any affiliation, endorsement, or partnership.
We make no representations or warranties, express or implied, regarding the accuracy, completeness, or suitability of any content or products presented. Nothing on this website should be construed as legal, tax, investment, financial, medical, or other professional advice. In addition, no part of this site—including articles or product references—constitutes a solicitation, recommendation, endorsement, advertisement, or offer to buy or sell any securities, franchises, or other financial instruments, particularly in jurisdictions where such activity would be unlawful.
All content is of a general nature and may not address the specific circumstances of any individual or entity. It is not a substitute for professional advice or services. Any actions you take based on the information provided here are strictly at your own risk. You accept full responsibility for any decisions or outcomes arising from your use of this website and agree to release us from any liability in connection with your use of, or reliance upon, the content or products found herein.