
|
QILU BANK CO., LTD. (601665.Ss) Avaliação do DCF |
Totalmente Editável: Adapte-Se Às Suas Necessidades No Excel Ou Planilhas
Design Profissional: Modelos Confiáveis E Padrão Da Indústria
Pré-Construídos Para Uso Rápido E Eficiente
Compatível com MAC/PC, totalmente desbloqueado
Não É Necessária Experiência; Fácil De Seguir
Qilu Bank Co., Ltd. (601665.SS) Bundle
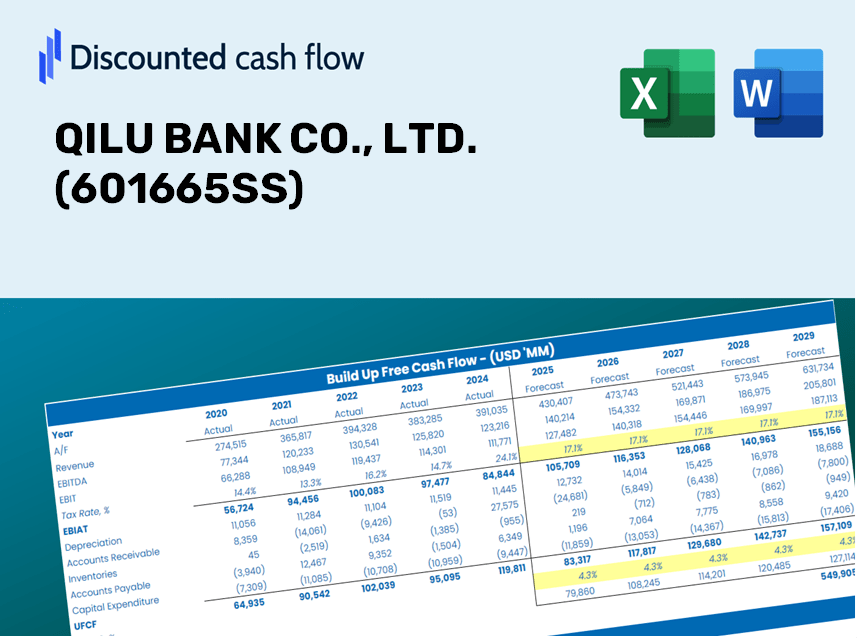
Explore as perspectivas financeiras do Qilu Bank Co., Ltd. (601665Ss) com nossa calculadora DCF amigável! Digite suas projeções de crescimento, margens e despesas para calcular o valor intrínseco do Qilu Bank Co., Ltd. (601665Ss) e aprimore sua estratégia de investimento.
Discounted Cash Flow (DCF) - (USD MM)
| Year | AY1 2020 |
AY2 2021 |
AY3 2022 |
AY4 2023 |
AY5 2024 |
FY1 2025 |
FY2 2026 |
FY3 2027 |
FY4 2028 |
FY5 2029 |
|---|---|---|---|---|---|---|---|---|---|---|
| Revenue | 5,203.6 | 6,063.1 | 20,350.2 | 7,564.5 | 8,734.3 | 10,244.3 | 12,015.3 | 14,092.5 | 16,528.9 | 19,386.4 |
| Revenue Growth, % | 0 | 16.52 | 235.64 | -62.83 | 15.46 | 17.29 | 17.29 | 17.29 | 17.29 | 17.29 |
| EBITDA | 2,993.3 | 4,334.1 | 4,100.7 | 4,766.0 | 5,515.6 | 5,640.8 | 6,615.9 | 7,759.7 | 9,101.2 | 10,674.6 |
| EBITDA, % | 57.52 | 71.48 | 20.15 | 63 | 63.15 | 55.06 | 55.06 | 55.06 | 55.06 | 55.06 |
| Depreciation | 201.3 | .0 | .0 | 353.0 | 359.1 | 259.1 | 303.9 | 356.4 | 418.0 | 490.3 |
| Depreciation, % | 3.87 | 0 | 0 | 4.67 | 4.11 | 2.53 | 2.53 | 2.53 | 2.53 | 2.53 |
| EBIT | 2,792.1 | 4,334.1 | 4,100.7 | 4,413.0 | 5,156.6 | 5,381.7 | 6,312.1 | 7,403.3 | 8,683.2 | 10,184.3 |
| EBIT, % | 53.66 | 71.48 | 20.15 | 58.34 | 59.04 | 52.53 | 52.53 | 52.53 | 52.53 | 52.53 |
| Total Cash | 37,788.4 | 40,328.2 | 42,078.3 | 46,470.4 | 44,389.1 | 10,244.3 | 12,015.3 | 14,092.5 | 16,528.9 | 19,386.4 |
| Total Cash, percent | .0 | .0 | .0 | .0 | .0 | .0 | .0 | .0 | .0 | .0 |
| Account Receivables | .0 | .0 | .0 | .0 | .0 | .0 | .0 | .0 | .0 | .0 |
| Account Receivables, % | 0 | 0 | 0 | 0 | 0 | 0 | 0 | 0 | 0 | 0 |
| Inventories | .0 | .0 | .0 | .0 | .0 | .0 | .0 | .0 | .0 | .0 |
| Inventories, % | 0 | 0 | 0 | 0 | 0 | 0 | 0 | 0 | 0 | 0 |
| Accounts Payable | .0 | .0 | .0 | .0 | .0 | .0 | .0 | .0 | .0 | .0 |
| Accounts Payable, % | 0 | 0 | 0 | 0 | 0 | 0 | 0 | 0 | 0 | 0 |
| Capital Expenditure | -356.1 | -227.3 | -193.2 | -278.1 | -245.3 | -369.3 | -433.2 | -508.1 | -595.9 | -698.9 |
| Capital Expenditure, % | -6.84 | -3.75 | -0.94948 | -3.68 | -2.81 | -3.61 | -3.61 | -3.61 | -3.61 | -3.61 |
| Tax Rate, % | 3.3 | 3.3 | 3.3 | 3.3 | 3.3 | 3.3 | 3.3 | 3.3 | 3.3 | 3.3 |
| EBITAT | 2,439.3 | 3,939.2 | 3,802.4 | 4,233.8 | 4,986.3 | 4,990.1 | 5,852.7 | 6,864.6 | 8,051.3 | 9,443.3 |
| Depreciation | ||||||||||
| Changes in Account Receivables | ||||||||||
| Changes in Inventories | ||||||||||
| Changes in Accounts Payable | ||||||||||
| Capital Expenditure | ||||||||||
| UFCF | 2,284.5 | 3,711.9 | 3,609.1 | 4,308.7 | 5,100.1 | 4,879.8 | 5,723.4 | 6,712.9 | 7,873.5 | 9,234.6 |
| WACC, % | 5.45 | 5.63 | 5.73 | 5.89 | 5.93 | 5.73 | 5.73 | 5.73 | 5.73 | 5.73 |
| PV UFCF | ||||||||||
| SUM PV UFCF | 28,705.4 | |||||||||
| Long Term Growth Rate, % | 2.00 | |||||||||
| Free cash flow (T + 1) | 9,419 | |||||||||
| Terminal Value | 252,600 | |||||||||
| Present Terminal Value | 191,189 | |||||||||
| Enterprise Value | 219,895 | |||||||||
| Net Debt | 62,052 | |||||||||
| Equity Value | 157,843 | |||||||||
| Diluted Shares Outstanding, MM | 6,233 | |||||||||
| Equity Value Per Share | 25.32 |
What You Will Receive
- Authentic Qilu Bank Data: Preloaded financial metrics – from total assets to net income – utilizing real and projected figures.
- Comprehensive Customization: Modify all essential parameters (yellow cells) such as WACC, growth %, and tax rates.
- Immediate Valuation Refresh: Automatic updates to assess the effects of adjustments on Qilu Bank’s fair value.
- Dynamic Excel Template: Designed for easy modifications, scenario analysis, and extensive forecasts.
- Efficient and Precise: Eliminate the need to construct models from the ground up while ensuring accuracy and adaptability.
Key Features
- Customizable Financial Inputs: Adjust essential factors such as loan growth, net interest margin, and operating expenses.
- Instant Valuation Reports: Automatically computes net asset value, return on equity, and other key metrics.
- Industry-Leading Precision: Leverages Qilu Bank's actual financial data for accurate valuation results.
- Effortless Scenario Analysis: Easily evaluate various financial scenarios and analyze results side by side.
- Efficiency Booster: Save time by avoiding the complexities of constructing intricate valuation models from the ground up.
How It Works
- Step 1: Download the prebuilt Excel template featuring Qilu Bank's data.
- Step 2: Review the pre-populated sheets to familiarize yourself with the key metrics.
- Step 3: Modify forecasts and assumptions in the editable yellow cells (WACC, growth, margins).
- Step 4: Immediately see recalculated results, including Qilu Bank's intrinsic value.
- Step 5: Use the outputs to make informed investment decisions or create reports.
Why Choose QILU BANK CO., LTD. (601665SS) Calculator?
- Time-Saving: Skip the hassle of building a DCF model from the ground up – it's immediately available for use.
- Enhanced Accuracy: Dependable financial data and formulas minimize valuation errors.
- Completely Customizable: Adjust the model to suit your specific assumptions and forecasts.
- User-Friendly: Intuitive charts and outputs facilitate easy analysis of results.
- Preferred by Professionals: Developed for experts who prioritize precision and functionality.
Who Can Benefit from This Product?
- Investors: Evaluate QILU BANK CO., LTD. (601665SS)'s valuation prior to making investment decisions.
- CFOs and Financial Analysts: Enhance valuation processes and assess financial projections.
- Startup Founders: Gain insights into how established financial institutions like QILU BANK CO., LTD. (601665SS) are valued.
- Consultants: Provide expert valuation reports for your clients.
- Students and Educators: Employ real-life data to learn and teach valuation methodologies.
Contents of the Template
- In-Depth DCF Model: Fully editable template featuring comprehensive valuation calculations.
- Current Market Data: Preloaded historical and projected financials for QILU BANK CO., LTD. (601665SS) to facilitate analysis.
- Flexible Parameters: Modify WACC, growth rates, and tax assumptions to explore various scenarios.
- Financial Statements Overview: Complete annual and quarterly financial breakdowns for enhanced insights.
- Essential Ratios: Integrated analysis focusing on profitability, efficiency, and leverage metrics.
- Interactive Dashboard: Visual outputs through charts and tables for clear and actionable results.
Disclaimer
All information, articles, and product details provided on this website are for general informational and educational purposes only. We do not claim any ownership over, nor do we intend to infringe upon, any trademarks, copyrights, logos, brand names, or other intellectual property mentioned or depicted on this site. Such intellectual property remains the property of its respective owners, and any references here are made solely for identification or informational purposes, without implying any affiliation, endorsement, or partnership.
We make no representations or warranties, express or implied, regarding the accuracy, completeness, or suitability of any content or products presented. Nothing on this website should be construed as legal, tax, investment, financial, medical, or other professional advice. In addition, no part of this site—including articles or product references—constitutes a solicitation, recommendation, endorsement, advertisement, or offer to buy or sell any securities, franchises, or other financial instruments, particularly in jurisdictions where such activity would be unlawful.
All content is of a general nature and may not address the specific circumstances of any individual or entity. It is not a substitute for professional advice or services. Any actions you take based on the information provided here are strictly at your own risk. You accept full responsibility for any decisions or outcomes arising from your use of this website and agree to release us from any liability in connection with your use of, or reliance upon, the content or products found herein.