
|
China State Construction Engineering Corporation Limited (601668.SS) Avaliação DCF |
Totalmente Editável: Adapte-Se Às Suas Necessidades No Excel Ou Planilhas
Design Profissional: Modelos Confiáveis E Padrão Da Indústria
Pré-Construídos Para Uso Rápido E Eficiente
Compatível com MAC/PC, totalmente desbloqueado
Não É Necessária Experiência; Fácil De Seguir
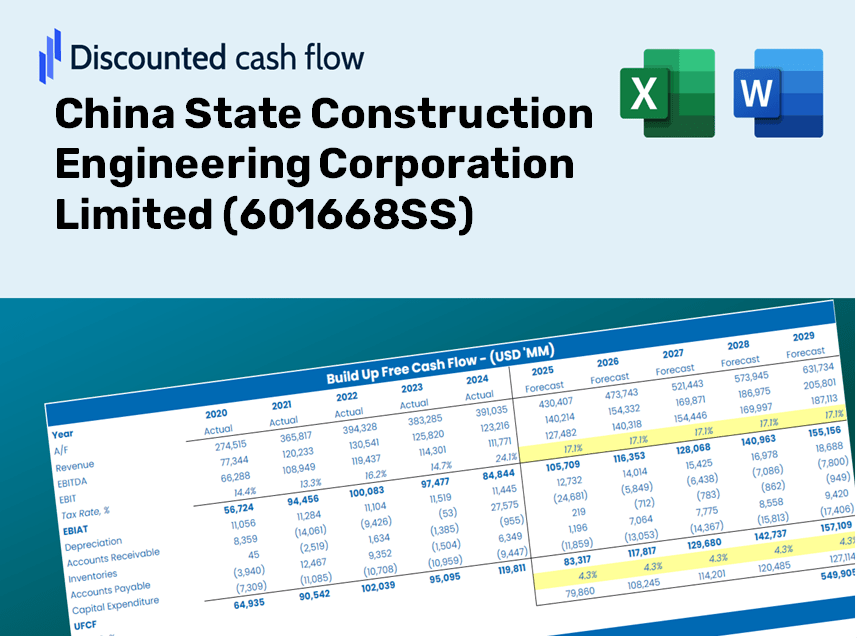
China State Construction Engineering Corporation Limited (601668.SS) Bundle
Obtenha uma visão da sua análise de avaliação da China Este modelo do Excel é pré -carregado com dados reais para (601668Ss), permitindo que você ajuste as previsões e suposições para determinar com precisão o valor intrínseco da China State Construction Engineering Corporation Limited.
Discounted Cash Flow (DCF) - (USD MM)
| Year | AY1 2020 |
AY2 2021 |
AY3 2022 |
AY4 2023 |
AY5 2024 |
FY1 2025 |
FY2 2026 |
FY3 2027 |
FY4 2028 |
FY5 2029 |
|---|---|---|---|---|---|---|---|---|---|---|
| Revenue | 1,615,050.5 | 1,892,706.3 | 2,055,052.1 | 2,265,529.2 | 2,187,147.8 | 2,365,134.7 | 2,557,605.9 | 2,765,740.1 | 2,990,811.9 | 3,234,199.8 |
| Revenue Growth, % | 0 | 17.19 | 8.58 | 10.24 | -3.46 | 8.14 | 8.14 | 8.14 | 8.14 | 8.14 |
| EBITDA | 105,235.6 | 117,353.1 | 112,327.8 | 121,074.1 | 113,192.9 | 135,766.7 | 146,815.2 | 158,762.8 | 171,682.7 | 185,654.0 |
| EBITDA, % | 6.52 | 6.2 | 5.47 | 5.34 | 5.18 | 5.74 | 5.74 | 5.74 | 5.74 | 5.74 |
| Depreciation | 8,604.3 | 9,396.2 | 10,681.5 | 12,200.0 | 12,734.3 | 12,628.4 | 13,656.1 | 14,767.4 | 15,969.2 | 17,268.7 |
| Depreciation, % | 0.53276 | 0.49644 | 0.51977 | 0.5385 | 0.58224 | 0.53394 | 0.53394 | 0.53394 | 0.53394 | 0.53394 |
| EBIT | 96,631.3 | 107,956.9 | 101,646.3 | 108,874.1 | 100,458.5 | 123,138.3 | 133,159.1 | 143,995.4 | 155,713.5 | 168,385.3 |
| EBIT, % | 5.98 | 5.7 | 4.95 | 4.81 | 4.59 | 5.21 | 5.21 | 5.21 | 5.21 | 5.21 |
| Total Cash | 296,101.6 | 327,532.1 | 335,274.3 | 370,302.3 | 424,411.2 | 414,860.4 | 448,621.2 | 485,129.3 | 524,608.4 | 567,300.2 |
| Total Cash, percent | .0 | .0 | .0 | .0 | .0 | .0 | .0 | .0 | .0 | .0 |
| Account Receivables | 515,815.7 | 478,732.9 | 557,576.1 | 599,619.3 | 836,630.9 | 705,201.8 | 762,590.1 | 824,648.6 | 891,757.2 | 964,327.1 |
| Account Receivables, % | 31.94 | 25.29 | 27.13 | 26.47 | 38.25 | 29.82 | 29.82 | 29.82 | 29.82 | 29.82 |
| Inventories | 675,125.3 | 703,446.1 | 771,548.6 | 796,342.9 | 772,147.0 | 884,402.0 | 956,373.3 | 1,034,201.5 | 1,118,363.3 | 1,209,374.1 |
| Inventories, % | 41.8 | 37.17 | 37.54 | 35.15 | 35.3 | 37.39 | 37.39 | 37.39 | 37.39 | 37.39 |
| Accounts Payable | 492,162.4 | 508,725.3 | 578,213.7 | 680,452.6 | 844,282.3 | 729,052.4 | 788,381.6 | 852,538.9 | 921,917.3 | 996,941.5 |
| Accounts Payable, % | 30.47 | 26.88 | 28.14 | 30.04 | 38.6 | 30.82 | 30.82 | 30.82 | 30.82 | 30.82 |
| Capital Expenditure | -49,497.7 | -31,118.1 | -25,948.6 | -34,055.6 | -19,804.7 | -39,640.9 | -42,866.8 | -46,355.3 | -50,127.6 | -54,206.9 |
| Capital Expenditure, % | -3.06 | -1.64 | -1.26 | -1.5 | -0.9055 | -1.68 | -1.68 | -1.68 | -1.68 | -1.68 |
| Tax Rate, % | 42.29 | 42.29 | 42.29 | 42.29 | 42.29 | 42.29 | 42.29 | 42.29 | 42.29 | 42.29 |
| EBITAT | 46,049.1 | 55,078.4 | 58,297.8 | 63,529.6 | 57,971.8 | 67,008.3 | 72,461.4 | 78,358.2 | 84,734.8 | 91,630.4 |
| Depreciation | ||||||||||
| Changes in Account Receivables | ||||||||||
| Changes in Inventories | ||||||||||
| Changes in Accounts Payable | ||||||||||
| Capital Expenditure | ||||||||||
| UFCF | -693,622.9 | 58,681.4 | -34,426.5 | 77,075.4 | 1,915.5 | -56,060.0 | -26,779.8 | -28,959.1 | -31,315.7 | -33,864.1 |
| WACC, % | 2.58 | 2.67 | 2.84 | 2.87 | 2.85 | 2.76 | 2.76 | 2.76 | 2.76 | 2.76 |
| PV UFCF | ||||||||||
| SUM PV UFCF | -164,234.0 | |||||||||
| Long Term Growth Rate, % | 1.00 | |||||||||
| Free cash flow (T + 1) | -34,203 | |||||||||
| Terminal Value | -1,941,485 | |||||||||
| Present Terminal Value | -1,694,252 | |||||||||
| Enterprise Value | -1,858,486 | |||||||||
| Net Debt | 318,052 | |||||||||
| Equity Value | -2,176,538 | |||||||||
| Diluted Shares Outstanding, MM | 41,610 | |||||||||
| Equity Value Per Share | -52.31 |
What You Will Receive
- Accurate CSCEC Financials: Access to historical and projected data for precise valuation.
- Customizable Parameters: Adjust WACC, tax rates, revenue growth, and capital expenditures.
- Real-Time Calculations: Automatic computation of intrinsic value and NPV.
- Comprehensive Scenario Analysis: Explore various scenarios to assess the future outlook of China State Construction Engineering Corporation (601668SS).
- User-Friendly Interface: Designed for experts while remaining approachable for newcomers.
Key Features
- Customizable Forecast Inputs: Adjust essential figures such as revenue growth, EBITDA %, and capital expenditures.
- Instant DCF Valuation: Provides immediate calculations for intrinsic value, NPV, and additional outputs.
- High-Precision Accuracy: Incorporates China State Construction Engineering Corporation Limited's real financial data for realistic valuation results.
- Simplified Scenario Analysis: Effortlessly test various assumptions and evaluate their impacts.
- Efficiency Booster: Avoid the complexities of building detailed valuation models from the ground up.
How It Works
- Step 1: Download the Excel file for China State Construction Engineering Corporation Limited (601668SS).
- Step 2: Examine the pre-filled financial data and projections for the company.
- Step 3: Adjust key parameters such as revenue growth, WACC, and tax rates in the highlighted cells.
- Step 4: Observe the DCF model update in real-time as you modify your assumptions.
- Step 5: Review the results and leverage the insights for your investment decisions.
Why Opt for This Calculator?
- Comprehensive Toolset: Offers DCF, WACC, and a range of financial ratio analyses all in a single solution.
- Customizable Parameters: Modify the yellow-highlighted fields to explore different scenarios.
- In-depth Analysis: Automatically computes China State Construction Engineering Corporation Limited’s intrinsic value and Net Present Value.
- Preloaded Information: Access to both historical and projected data provides reliable starting points.
- Professional Standard: Perfectly suited for financial analysts, investors, and business consultants.
Who Can Benefit from Our Solutions?
- Investors: Make informed investment choices with our advanced valuation tool for (601668SS).
- Financial Analysts: Enhance efficiency with our customizable DCF model designed for (601668SS).
- Consultants: Effortlessly modify the template for impactful client presentations or reports concerning (601668SS).
- Finance Enthusiasts: Expand your knowledge of valuation methodologies with practical examples from (601668SS).
- Educators and Students: Utilize this resource as a hands-on educational tool in finance courses related to (601668SS).
Contents of the Template
- Pre-Filled DCF Model: Financial data for China State Construction Engineering Corporation Limited (601668SS) preloaded for immediate application.
- WACC Calculator: Comprehensive calculations for the Weighted Average Cost of Capital.
- Financial Ratios: Assess the profitability, leverage, and efficiency of China State Construction Engineering Corporation Limited (601668SS).
- Editable Inputs: Modify assumptions such as growth rates, margins, and CAPEX to suit your specific scenarios.
- Financial Statements: Access annual and quarterly reports to facilitate in-depth analysis.
- Interactive Dashboard: Effortlessly visualize key valuation metrics and outcomes.
Disclaimer
All information, articles, and product details provided on this website are for general informational and educational purposes only. We do not claim any ownership over, nor do we intend to infringe upon, any trademarks, copyrights, logos, brand names, or other intellectual property mentioned or depicted on this site. Such intellectual property remains the property of its respective owners, and any references here are made solely for identification or informational purposes, without implying any affiliation, endorsement, or partnership.
We make no representations or warranties, express or implied, regarding the accuracy, completeness, or suitability of any content or products presented. Nothing on this website should be construed as legal, tax, investment, financial, medical, or other professional advice. In addition, no part of this site—including articles or product references—constitutes a solicitation, recommendation, endorsement, advertisement, or offer to buy or sell any securities, franchises, or other financial instruments, particularly in jurisdictions where such activity would be unlawful.
All content is of a general nature and may not address the specific circumstances of any individual or entity. It is not a substitute for professional advice or services. Any actions you take based on the information provided here are strictly at your own risk. You accept full responsibility for any decisions or outcomes arising from your use of this website and agree to release us from any liability in connection with your use of, or reliance upon, the content or products found herein.