
|
Ningbo Tuopu Group Co., Ltd. (601689.Ss) Avaliação do DCF |
Totalmente Editável: Adapte-Se Às Suas Necessidades No Excel Ou Planilhas
Design Profissional: Modelos Confiáveis E Padrão Da Indústria
Pré-Construídos Para Uso Rápido E Eficiente
Compatível com MAC/PC, totalmente desbloqueado
Não É Necessária Experiência; Fácil De Seguir
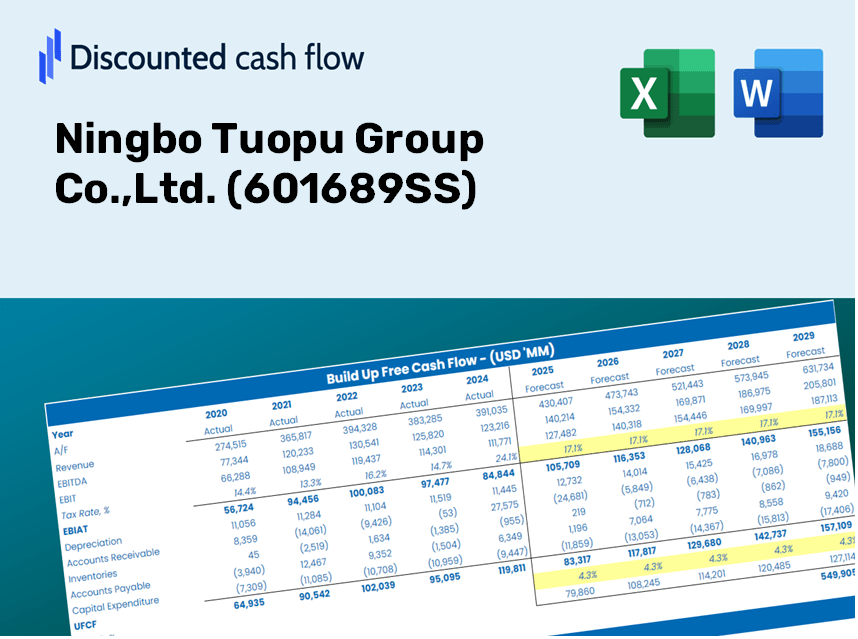
Ningbo Tuopu Group Co.,Ltd. (601689.SS) Bundle
Explore o Ningbo Tuopu Group Co., Ltd. (601689SS) Prospects com nossa calculadora DCF amigável! Digite suas projeções de crescimento, margens de lucro e despesas para derivar o valor intrínseco da Ningbo Tuopu Group Co., Ltd. (601689Ss) e refine sua abordagem de investimento.
Discounted Cash Flow (DCF) - (USD MM)
| Year | AY1 2020 |
AY2 2021 |
AY3 2022 |
AY4 2023 |
AY5 2024 |
FY1 2025 |
FY2 2026 |
FY3 2027 |
FY4 2028 |
FY5 2029 |
|---|---|---|---|---|---|---|---|---|---|---|
| Revenue | 6,511.1 | 11,462.7 | 15,992.8 | 19,700.6 | 26,600.3 | 38,156.6 | 54,733.4 | 78,511.8 | 112,620.4 | 161,547.3 |
| Revenue Growth, % | 0 | 76.05 | 39.52 | 23.18 | 35.02 | 43.44 | 43.44 | 43.44 | 43.44 | 43.44 |
| EBITDA | 1,122.8 | 1,706.0 | 2,653.1 | 3,551.2 | 4,731.8 | 6,450.9 | 9,253.5 | 13,273.6 | 19,040.2 | 27,312.0 |
| EBITDA, % | 17.24 | 14.88 | 16.59 | 18.03 | 17.79 | 16.91 | 16.91 | 16.91 | 16.91 | 16.91 |
| Depreciation | 463.1 | 549.9 | 781.3 | 1,145.6 | 1,505.2 | 2,157.4 | 3,094.6 | 4,439.0 | 6,367.5 | 9,133.8 |
| Depreciation, % | 7.11 | 4.8 | 4.89 | 5.82 | 5.66 | 5.65 | 5.65 | 5.65 | 5.65 | 5.65 |
| EBIT | 659.7 | 1,156.1 | 1,871.8 | 2,405.6 | 3,226.7 | 4,293.6 | 6,158.9 | 8,834.6 | 12,672.7 | 18,178.2 |
| EBIT, % | 10.13 | 10.09 | 11.7 | 12.21 | 12.13 | 11.25 | 11.25 | 11.25 | 11.25 | 11.25 |
| Total Cash | 787.3 | 1,593.0 | 2,796.5 | 3,156.2 | 5,037.8 | 5,985.6 | 8,585.9 | 12,316.0 | 17,666.6 | 25,341.7 |
| Total Cash, percent | .0 | .0 | .0 | .0 | .0 | .0 | .0 | .0 | .0 | .0 |
| Account Receivables | 2,821.8 | 4,814.0 | 6,056.5 | 6,690.4 | 9,190.5 | 14,630.4 | 20,986.5 | 30,103.8 | 43,182.2 | 61,942.2 |
| Account Receivables, % | 43.34 | 42 | 37.87 | 33.96 | 34.55 | 38.34 | 38.34 | 38.34 | 38.34 | 38.34 |
| Inventories | 1,502.8 | 2,297.0 | 3,255.9 | 3,244.8 | 4,000.1 | 7,248.6 | 10,397.7 | 14,914.9 | 21,394.6 | 30,689.3 |
| Inventories, % | 23.08 | 20.04 | 20.36 | 16.47 | 15.04 | 19 | 19 | 19 | 19 | 19 |
| Accounts Payable | 3,369.6 | 5,559.2 | 7,814.9 | 8,262.7 | 9,338.7 | 17,259.3 | 24,757.4 | 35,513.0 | 50,941.3 | 73,072.3 |
| Accounts Payable, % | 51.75 | 48.5 | 48.87 | 41.94 | 35.11 | 45.23 | 45.23 | 45.23 | 45.23 | 45.23 |
| Capital Expenditure | -1,406.0 | -3,520.6 | -5,425.6 | -3,176.9 | -3,145.9 | -8,713.8 | -12,499.5 | -17,929.8 | -25,719.2 | -36,892.6 |
| Capital Expenditure, % | -21.59 | -30.71 | -33.93 | -16.13 | -11.83 | -22.84 | -22.84 | -22.84 | -22.84 | -22.84 |
| Tax Rate, % | 12.3 | 12.3 | 12.3 | 12.3 | 12.3 | 12.3 | 12.3 | 12.3 | 12.3 | 12.3 |
| EBITAT | 583.6 | 1,026.0 | 1,623.8 | 2,101.1 | 2,829.9 | 3,769.9 | 5,407.6 | 7,756.9 | 11,126.9 | 15,960.8 |
| Depreciation | ||||||||||
| Changes in Account Receivables | ||||||||||
| Changes in Inventories | ||||||||||
| Changes in Accounts Payable | ||||||||||
| Capital Expenditure | ||||||||||
| UFCF | -1,314.2 | -2,541.6 | -2,966.2 | -105.2 | -990.0 | -3,554.6 | -6,004.3 | -8,612.8 | -12,354.5 | -17,721.8 |
| WACC, % | 7.61 | 7.61 | 7.61 | 7.61 | 7.61 | 7.61 | 7.61 | 7.61 | 7.61 | 7.61 |
| PV UFCF | ||||||||||
| SUM PV UFCF | -36,892.2 | |||||||||
| Long Term Growth Rate, % | 4.00 | |||||||||
| Free cash flow (T + 1) | -18,431 | |||||||||
| Terminal Value | -510,270 | |||||||||
| Present Terminal Value | -353,588 | |||||||||
| Enterprise Value | -390,480 | |||||||||
| Net Debt | 1,391 | |||||||||
| Equity Value | -391,872 | |||||||||
| Diluted Shares Outstanding, MM | 1,686 | |||||||||
| Equity Value Per Share | -232.46 |
Benefits You Will Receive
- Adjustable Forecast Parameters: Easily modify assumptions (growth %, margins, WACC) to generate various scenarios.
- Comprehensive Data: Ningbo Tuopu Group Co., Ltd.'s financial information pre-loaded to enhance your analysis.
- Instant DCF Results: The template automatically computes Net Present Value (NPV) and intrinsic value for you.
- Tailorable and Professional Design: A sleek Excel model that can be customized to meet your valuation requirements.
- Designed for Analysts and Investors: Perfect for evaluating projections, validating strategies, and optimizing your time.
Key Features
- Comprehensive Ningbo Tuopu Data: Filled with historical financial performance and future projections for Ningbo Tuopu Group Co.,Ltd. (601689SS).
- Customizable Variables: Modify revenue growth rates, profit margins, discount rates, tax percentages, and capital spending as needed.
- Interactive Valuation Model: Real-time updates to Net Present Value (NPV) and intrinsic value based on user inputs.
- Scenario Analysis: Develop various forecasting scenarios to evaluate different valuation possibilities.
- Intuitive Interface: Streamlined, organized design suitable for both experts and newcomers.
How It Works
- Download the Template: Gain immediate access to the Excel-based Ningbo Tuopu Group DCF Calculator.
- Input Your Assumptions: Modify the yellow-highlighted cells for growth rates, WACC, margins, and additional parameters.
- Instant Calculations: The model automatically computes Ningbo Tuopu Group's intrinsic value.
- Test Scenarios: Experiment with various assumptions to assess potential changes in valuation.
- Analyze and Decide: Utilize the results to inform your investment or financial analysis.
Why Opt for Ningbo Tuopu Group Co., Ltd. (601689SS)?
- Time Efficiency: Skip the hassle of building models from the ground up – our solutions are ready to implement.
- Enhanced Accuracy: Dependable financial data and formulas minimize valuation discrepancies.
- Completely Customizable: Adjust the model to suit your specific assumptions and forecasts.
- User-Friendly: Intuitive charts and outputs make interpreting results straightforward.
- Endorsed by Professionals: Crafted for experts who prioritize accuracy and functionality.
Who Can Benefit from This Product?
- Individual Investors: Gain insights to make informed choices regarding investments in Ningbo Tuopu Group Co.,Ltd. (601689SS).
- Financial Analysts: Enhance your valuation processes with comprehensive financial models tailored for Ningbo Tuopu Group Co.,Ltd. (601689SS).
- Consultants: Provide clients with precise and timely valuation analyses for Ningbo Tuopu Group Co.,Ltd. (601689SS).
- Business Owners: Learn about the valuation methods of major companies like Ningbo Tuopu Group Co.,Ltd. (601689SS) to inform your own business strategies.
- Finance Students: Explore valuation practices using real-time data and case studies, including Ningbo Tuopu Group Co.,Ltd. (601689SS).
What the Template Contains for Ningbo Tuopu Group Co., Ltd. (601689SS)
- Preloaded Ningbo Tuopu Data: Historical and forecasted financial figures, including revenue, EBIT, and capital expenditures.
- DCF and WACC Models: Advanced spreadsheets designed for determining intrinsic value and Weighted Average Cost of Capital.
- Editable Inputs: Yellow-highlighted cells for modifying revenue growth rates, tax rates, and discount rates.
- Financial Statements: Detailed annual and quarterly financial reports for in-depth analysis.
- Key Ratios: Metrics on profitability, leverage, and efficiency to assess performance.
- Dashboard and Charts: Visual representations of valuation results and underlying assumptions.
Disclaimer
All information, articles, and product details provided on this website are for general informational and educational purposes only. We do not claim any ownership over, nor do we intend to infringe upon, any trademarks, copyrights, logos, brand names, or other intellectual property mentioned or depicted on this site. Such intellectual property remains the property of its respective owners, and any references here are made solely for identification or informational purposes, without implying any affiliation, endorsement, or partnership.
We make no representations or warranties, express or implied, regarding the accuracy, completeness, or suitability of any content or products presented. Nothing on this website should be construed as legal, tax, investment, financial, medical, or other professional advice. In addition, no part of this site—including articles or product references—constitutes a solicitation, recommendation, endorsement, advertisement, or offer to buy or sell any securities, franchises, or other financial instruments, particularly in jurisdictions where such activity would be unlawful.
All content is of a general nature and may not address the specific circumstances of any individual or entity. It is not a substitute for professional advice or services. Any actions you take based on the information provided here are strictly at your own risk. You accept full responsibility for any decisions or outcomes arising from your use of this website and agree to release us from any liability in connection with your use of, or reliance upon, the content or products found herein.