
|
Lifan Technology Co., Ltd. (601777.SS) Avaliação DCF |
Totalmente Editável: Adapte-Se Às Suas Necessidades No Excel Ou Planilhas
Design Profissional: Modelos Confiáveis E Padrão Da Indústria
Pré-Construídos Para Uso Rápido E Eficiente
Compatível com MAC/PC, totalmente desbloqueado
Não É Necessária Experiência; Fácil De Seguir
Lifan Technology (Group) Co., Ltd. (601777.SS) Bundle
Ganhe insights sobre sua análise de avaliação da Lifan Technology (Group) Co., Ltd. (601777Ss) usando nossa calculadora DCF de última geração! Este modelo do Excel é pré -carregado com dados reais (601777Ss), permitindo que você ajuste as previsões e suposições para determinar com precisão o valor intrínseco da tecnologia LIFAN (Grupo) Co., Ltd.
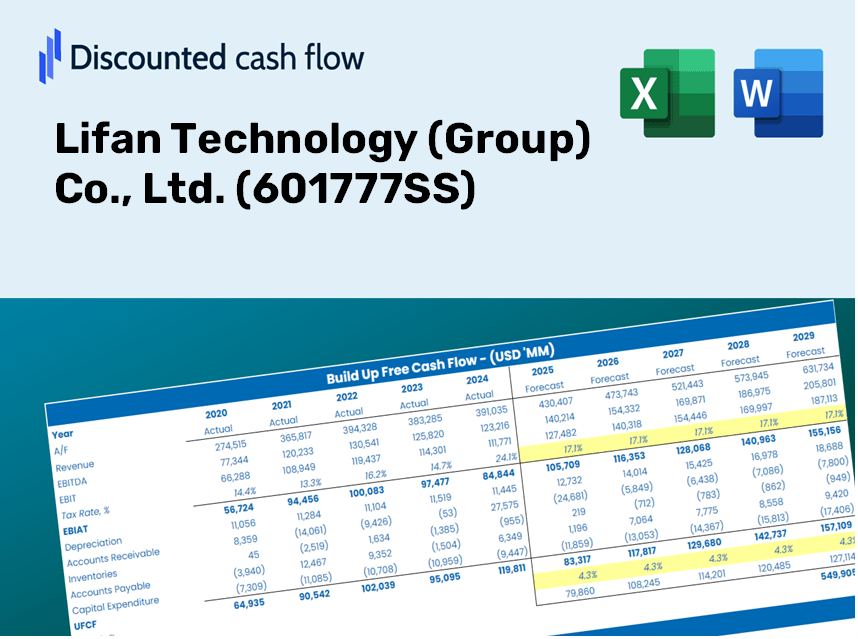
Discounted Cash Flow (DCF) - (USD MM)
| Year | AY1 2020 |
AY2 2021 |
AY3 2022 |
AY4 2023 |
AY5 2024 |
FY1 2025 |
FY2 2026 |
FY3 2027 |
FY4 2028 |
FY5 2029 |
|---|---|---|---|---|---|---|---|---|---|---|
| Revenue | 3,637.1 | 3,977.2 | 8,654.2 | 6,768.3 | 7,035.2 | 8,644.5 | 10,622.0 | 13,051.9 | 16,037.6 | 19,706.3 |
| Revenue Growth, % | 0 | 9.35 | 117.59 | -21.79 | 3.94 | 22.88 | 22.88 | 22.88 | 22.88 | 22.88 |
| EBITDA | -1,441.0 | 73.0 | 56.6 | -417.4 | -372.6 | -840.1 | -1,032.3 | -1,268.5 | -1,558.6 | -1,915.2 |
| EBITDA, % | -39.62 | 1.84 | 0.65385 | -6.17 | -5.3 | -9.72 | -9.72 | -9.72 | -9.72 | -9.72 |
| Depreciation | 334.0 | 166.3 | 163.0 | 331.9 | 203.9 | 398.5 | 489.7 | 601.7 | 739.4 | 908.5 |
| Depreciation, % | 9.18 | 4.18 | 1.88 | 4.9 | 2.9 | 4.61 | 4.61 | 4.61 | 4.61 | 4.61 |
| EBIT | -1,775.0 | -93.3 | -106.4 | -749.3 | -576.4 | -1,238.7 | -1,522.0 | -1,870.2 | -2,298.0 | -2,823.7 |
| EBIT, % | -48.8 | -2.35 | -1.23 | -11.07 | -8.19 | -14.33 | -14.33 | -14.33 | -14.33 | -14.33 |
| Total Cash | 2,461.7 | 2,755.9 | 2,721.5 | 3,424.7 | 3,679.4 | 4,690.8 | 5,763.9 | 7,082.4 | 8,702.6 | 10,693.3 |
| Total Cash, percent | .0 | .0 | .0 | .0 | .0 | .0 | .0 | .0 | .0 | .0 |
| Account Receivables | 643.2 | 767.5 | 3,254.3 | 1,517.0 | 1,807.8 | 2,121.3 | 2,606.5 | 3,202.8 | 3,935.5 | 4,835.7 |
| Account Receivables, % | 17.68 | 19.3 | 37.6 | 22.41 | 25.7 | 24.54 | 24.54 | 24.54 | 24.54 | 24.54 |
| Inventories | 2,694.6 | 2,197.2 | 2,382.1 | 2,868.6 | 2,267.0 | 4,001.8 | 4,917.2 | 6,042.0 | 7,424.2 | 9,122.5 |
| Inventories, % | 74.09 | 55.25 | 27.53 | 42.38 | 32.22 | 46.29 | 46.29 | 46.29 | 46.29 | 46.29 |
| Accounts Payable | 833.0 | 1,178.8 | 2,955.2 | 1,547.1 | 5,678.9 | 3,289.6 | 4,042.1 | 4,966.7 | 6,102.9 | 7,499.0 |
| Accounts Payable, % | 22.9 | 29.64 | 34.15 | 22.86 | 80.72 | 38.05 | 38.05 | 38.05 | 38.05 | 38.05 |
| Capital Expenditure | -90.3 | -51.8 | -225.3 | -466.6 | -397.5 | -327.3 | -402.2 | -494.2 | -607.2 | -746.1 |
| Capital Expenditure, % | -2.48 | -1.3 | -2.6 | -6.89 | -5.65 | -3.79 | -3.79 | -3.79 | -3.79 | -3.79 |
| Tax Rate, % | 113.95 | 113.95 | 113.95 | 113.95 | 113.95 | 113.95 | 113.95 | 113.95 | 113.95 | 113.95 |
| EBITAT | -1,386.0 | -49.8 | -73.5 | 50.7 | 80.4 | -496.6 | -610.2 | -749.8 | -921.4 | -1,132.1 |
| Depreciation | ||||||||||
| Changes in Account Receivables | ||||||||||
| Changes in Inventories | ||||||||||
| Changes in Accounts Payable | ||||||||||
| Capital Expenditure | ||||||||||
| UFCF | -3,647.1 | 783.7 | -1,031.0 | -241.4 | 4,329.4 | -4,863.1 | -1,170.9 | -1,438.8 | -1,767.9 | -2,172.3 |
| WACC, % | 5.53 | 5.48 | 5.51 | 5.37 | 5.37 | 5.45 | 5.45 | 5.45 | 5.45 | 5.45 |
| PV UFCF | ||||||||||
| SUM PV UFCF | -9,988.0 | |||||||||
| Long Term Growth Rate, % | 4.00 | |||||||||
| Free cash flow (T + 1) | -2,259 | |||||||||
| Terminal Value | -156,023 | |||||||||
| Present Terminal Value | -119,673 | |||||||||
| Enterprise Value | -129,661 | |||||||||
| Net Debt | -2,241 | |||||||||
| Equity Value | -127,420 | |||||||||
| Diluted Shares Outstanding, MM | 4,002 | |||||||||
| Equity Value Per Share | -31.84 |
What You'll Receive
- Comprehensive 601777SS Financials: Access to both historical and projected data for precise valuation.
- Customizable Inputs: Adjust WACC, tax rates, revenue growth, and capital expenditures to fit your analysis.
- Real-Time Calculations: Dynamic computation of intrinsic value and NPV.
- Scenario Analysis: Evaluate various scenarios to assess the future outlook of Lifan Technology.
- User-Friendly Interface: Designed for experts while remaining approachable for newcomers.
Key Features
- Customizable Forecast Inputs: Adjust essential parameters such as revenue growth, EBITDA %, and capital investments for Lifan Technology (Group) Co., Ltd. (601777SS).
- Instant DCF Valuation: Quickly computes intrinsic value, NPV, and other valuable metrics.
- High-Precision Accuracy: Relies on Lifan's actual financial data to deliver practical valuation results.
- Effortless Scenario Analysis: Easily experiment with various assumptions and evaluate their effects.
- Efficiency Boost: Streamlines the valuation process by removing the need for complex model construction.
How It Works
- Download the Template: Gain immediate access to the Excel-based Lifan Technology DCF Calculator.
- Input Your Assumptions: Modify the yellow-highlighted cells for growth rates, WACC, margins, and more.
- Instant Calculations: The model automatically recalculates Lifan Technology’s intrinsic value.
- Test Scenarios: Experiment with different assumptions to assess potential valuation shifts.
- Analyze and Decide: Utilize the results to inform your investment or financial analysis decisions.
Why Choose This Calculator for Lifan Technology (Group) Co., Ltd. (601777SS)?
- User-Friendly Interface: Perfectly crafted for both novices and seasoned users.
- Customizable Inputs: Quickly adjust parameters to suit your analysis needs.
- Real-Time Valuation: Observe immediate updates to Lifan’s valuation as inputs are changed.
- Preloaded Data: Comes equipped with Lifan’s accurate financial information for fast assessments.
- Favored by Industry Experts: Utilized by investors and analysts for making strategic choices.
Who Should Use This Product?
- Investors: Assess Lifan Technology’s valuation before making stock trades.
- CFOs and Financial Analysts: Enhance valuation methods and evaluate financial forecasts.
- Startup Founders: Understand the valuation practices of established firms like Lifan Technology (601777SS).
- Consultants: Provide detailed valuation analyses and reports for clients.
- Students and Educators: Utilize current data to teach and learn valuation methodologies.
Contents of the Template
- Pre-Filled Data: Features Lifan Technology's (601777SS) historical financial data and projections.
- Discounted Cash Flow Model: An editable DCF valuation model with automated calculations.
- Weighted Average Cost of Capital (WACC): A specific sheet for calculating WACC using customized inputs.
- Key Financial Ratios: Evaluate Lifan Technology's profitability, efficiency, and leverage metrics.
- Customizable Inputs: Easily modify revenue growth, profit margins, and tax rates.
- Clear Dashboard: Visual representation of key valuation results through charts and tables.
Disclaimer
All information, articles, and product details provided on this website are for general informational and educational purposes only. We do not claim any ownership over, nor do we intend to infringe upon, any trademarks, copyrights, logos, brand names, or other intellectual property mentioned or depicted on this site. Such intellectual property remains the property of its respective owners, and any references here are made solely for identification or informational purposes, without implying any affiliation, endorsement, or partnership.
We make no representations or warranties, express or implied, regarding the accuracy, completeness, or suitability of any content or products presented. Nothing on this website should be construed as legal, tax, investment, financial, medical, or other professional advice. In addition, no part of this site—including articles or product references—constitutes a solicitation, recommendation, endorsement, advertisement, or offer to buy or sell any securities, franchises, or other financial instruments, particularly in jurisdictions where such activity would be unlawful.
All content is of a general nature and may not address the specific circumstances of any individual or entity. It is not a substitute for professional advice or services. Any actions you take based on the information provided here are strictly at your own risk. You accept full responsibility for any decisions or outcomes arising from your use of this website and agree to release us from any liability in connection with your use of, or reliance upon, the content or products found herein.