
|
Hainan Mining Co., Ltd. (601969.Ss) Avaliação DCF |
Totalmente Editável: Adapte-Se Às Suas Necessidades No Excel Ou Planilhas
Design Profissional: Modelos Confiáveis E Padrão Da Indústria
Pré-Construídos Para Uso Rápido E Eficiente
Compatível com MAC/PC, totalmente desbloqueado
Não É Necessária Experiência; Fácil De Seguir
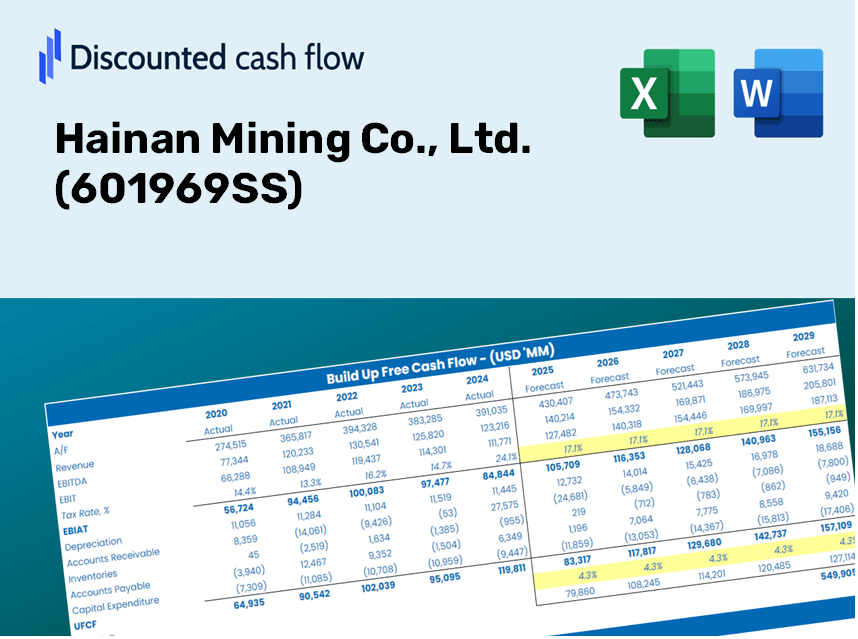
Hainan Mining Co., Ltd. (601969.SS) Bundle
Obtenha informações sobre sua análise de avaliação da Hainan Mining Co., Ltd. (601969Ss) usando nossa calculadora DCF de última geração! Este modelo do Excel é pré -carregado com dados reais (601969Ss), permitindo que você ajuste as previsões e suposições para determinar com precisão o valor intrínseco da Hainan Mining Co., Ltd.
Discounted Cash Flow (DCF) - (USD MM)
| Year | AY1 2020 |
AY2 2021 |
AY3 2022 |
AY4 2023 |
AY5 2024 |
FY1 2025 |
FY2 2026 |
FY3 2027 |
FY4 2028 |
FY5 2029 |
|---|---|---|---|---|---|---|---|---|---|---|
| Revenue | 2,763.7 | 4,119.0 | 4,829.9 | 4,678.7 | 4,065.5 | 4,574.4 | 5,146.9 | 5,791.1 | 6,515.9 | 7,331.5 |
| Revenue Growth, % | 0 | 49.04 | 17.26 | -3.13 | -13.11 | 12.52 | 12.52 | 12.52 | 12.52 | 12.52 |
| EBITDA | 764.9 | 1,833.2 | 1,828.3 | 1,664.1 | 1,770.0 | 1,730.4 | 1,947.0 | 2,190.7 | 2,464.9 | 2,773.4 |
| EBITDA, % | 27.68 | 44.51 | 37.85 | 35.57 | 43.54 | 37.83 | 37.83 | 37.83 | 37.83 | 37.83 |
| Depreciation | 550.4 | 522.1 | 894.9 | 752.2 | 836.1 | 802.9 | 903.4 | 1,016.5 | 1,143.7 | 1,286.8 |
| Depreciation, % | 19.92 | 12.67 | 18.53 | 16.08 | 20.57 | 17.55 | 17.55 | 17.55 | 17.55 | 17.55 |
| EBIT | 214.5 | 1,311.1 | 933.4 | 911.9 | 933.9 | 927.5 | 1,043.6 | 1,174.2 | 1,321.2 | 1,486.5 |
| EBIT, % | 7.76 | 31.83 | 19.33 | 19.49 | 22.97 | 20.28 | 20.28 | 20.28 | 20.28 | 20.28 |
| Total Cash | 2,220.1 | 3,680.6 | 3,948.7 | 3,361.1 | 2,018.0 | 3,411.7 | 3,838.8 | 4,319.2 | 4,859.8 | 5,468.1 |
| Total Cash, percent | .0 | .0 | .0 | .0 | .0 | .0 | .0 | .0 | .0 | .0 |
| Account Receivables | 788.3 | 1,402.3 | 1,260.1 | 1,373.5 | 853.9 | 1,271.8 | 1,431.0 | 1,610.1 | 1,811.6 | 2,038.4 |
| Account Receivables, % | 28.52 | 34.04 | 26.09 | 29.36 | 21 | 27.8 | 27.8 | 27.8 | 27.8 | 27.8 |
| Inventories | 223.8 | 322.7 | 409.1 | 296.5 | 402.2 | 371.7 | 418.3 | 470.6 | 529.5 | 595.8 |
| Inventories, % | 8.1 | 7.83 | 8.47 | 6.34 | 9.89 | 8.13 | 8.13 | 8.13 | 8.13 | 8.13 |
| Accounts Payable | 78.2 | 65.8 | 127.6 | 121.8 | 76.0 | 105.6 | 118.8 | 133.7 | 150.4 | 169.2 |
| Accounts Payable, % | 2.83 | 1.6 | 2.64 | 2.6 | 1.87 | 2.31 | 2.31 | 2.31 | 2.31 | 2.31 |
| Capital Expenditure | -445.4 | -325.8 | -679.8 | -1,180.1 | -1,605.6 | -940.6 | -1,058.4 | -1,190.8 | -1,339.9 | -1,507.6 |
| Capital Expenditure, % | -16.12 | -7.91 | -14.07 | -25.22 | -39.49 | -20.56 | -20.56 | -20.56 | -20.56 | -20.56 |
| Tax Rate, % | 15.81 | 15.81 | 15.81 | 15.81 | 15.81 | 15.81 | 15.81 | 15.81 | 15.81 | 15.81 |
| EBITAT | 181.4 | 933.2 | 682.2 | 692.8 | 786.2 | 721.5 | 811.8 | 913.5 | 1,027.8 | 1,156.4 |
| Depreciation | ||||||||||
| Changes in Account Receivables | ||||||||||
| Changes in Inventories | ||||||||||
| Changes in Accounts Payable | ||||||||||
| Capital Expenditure | ||||||||||
| UFCF | -647.6 | 404.1 | 1,015.0 | 258.3 | 384.8 | 226.0 | 464.4 | 522.5 | 587.9 | 661.5 |
| WACC, % | 8.51 | 8.43 | 8.44 | 8.46 | 8.51 | 8.47 | 8.47 | 8.47 | 8.47 | 8.47 |
| PV UFCF | ||||||||||
| SUM PV UFCF | 1,877.5 | |||||||||
| Long Term Growth Rate, % | 3.00 | |||||||||
| Free cash flow (T + 1) | 681 | |||||||||
| Terminal Value | 12,452 | |||||||||
| Present Terminal Value | 8,292 | |||||||||
| Enterprise Value | 10,170 | |||||||||
| Net Debt | 116 | |||||||||
| Equity Value | 10,053 | |||||||||
| Diluted Shares Outstanding, MM | 1,962 | |||||||||
| Equity Value Per Share | 5.12 |
What You Will Receive
- Authentic Hainan Mining Financials: Provides historical data and projections for precise valuation.
- Customizable Inputs: Adjust parameters like WACC, tax rates, revenue growth, and capital expenditures.
- Dynamic Calculations: Intrinsic value and NPV are computed automatically.
- Scenario Analysis: Explore various scenarios to assess Hainan Mining's future outlook.
- User-Friendly Design: Designed for industry professionals while remaining accessible for newcomers.
Key Features
- Comprehensive DCF Calculator: Offers detailed unlevered and levered DCF valuation models tailored for Hainan Mining Co., Ltd. (601969SS).
- WACC Calculator: Features a pre-configured Weighted Average Cost of Capital sheet with options for customization.
- Customizable Forecast Assumptions: Adjust parameters such as growth rates, capital expenditures, and discount rates.
- Integrated Financial Ratios: Evaluate profitability, leverage, and efficiency ratios specific to Hainan Mining Co., Ltd. (601969SS).
- User-Friendly Dashboard and Charts: Visual representations of key valuation metrics facilitate straightforward analysis.
How It Works
- Step 1: Download the Excel file for Hainan Mining Co., Ltd. (601969SS).
- Step 2: Examine the pre-filled financial data and projections for Hainan Mining.
- Step 3: Adjust key variables such as revenue growth, WACC, and tax rates (highlighted cells).
- Step 4: Observe the DCF model update in real-time as you modify your assumptions.
- Step 5: Evaluate the outputs and leverage the results to inform your investment decisions.
Why Choose Hainan Mining Co., Ltd. (601969SS)?
- Time Efficient: Skip the hassle of building models from the ground up – our tools are readily available.
- Enhanced Precision: Dependable financial insights and formulas minimize valuation errors.
- Completely Customizable: Adjust the model to align with your specific assumptions and forecasts.
- Simplified Analysis: Intuitive charts and outputs facilitate easy interpretation of results.
- Endorsed by Professionals: Crafted for industry experts who prioritize accuracy and functionality.
Who Should Consider Hainan Mining Co., Ltd. (601969SS)?
- Investors: Confidently assess Hainan Mining's intrinsic value prior to making investment choices.
- CFOs: Utilize a top-tier DCF model for comprehensive financial reporting and analysis.
- Consultants: Efficiently customize the valuation template for client reports.
- Entrepreneurs: Acquire valuable knowledge about financial modeling practices of leading firms.
- Educators: Implement this resource as a teaching aid to illustrate valuation techniques.
Contents of the Template
- Preloaded Hainan Mining Data: Historical and projected financial information, including revenue, EBIT, and capital expenditures.
- DCF and WACC Models: Advanced spreadsheets designed for calculating intrinsic value and Weighted Average Cost of Capital.
- Editable Inputs: Yellow-highlighted cells for customizing revenue growth, tax rates, and discount rates.
- Financial Statements: Detailed annual and quarterly financials for in-depth analysis.
- Key Ratios: Metrics for profitability, leverage, and efficiency to assess company performance.
- Dashboard and Charts: Visual representations of valuation results and underlying assumptions.
Disclaimer
All information, articles, and product details provided on this website are for general informational and educational purposes only. We do not claim any ownership over, nor do we intend to infringe upon, any trademarks, copyrights, logos, brand names, or other intellectual property mentioned or depicted on this site. Such intellectual property remains the property of its respective owners, and any references here are made solely for identification or informational purposes, without implying any affiliation, endorsement, or partnership.
We make no representations or warranties, express or implied, regarding the accuracy, completeness, or suitability of any content or products presented. Nothing on this website should be construed as legal, tax, investment, financial, medical, or other professional advice. In addition, no part of this site—including articles or product references—constitutes a solicitation, recommendation, endorsement, advertisement, or offer to buy or sell any securities, franchises, or other financial instruments, particularly in jurisdictions where such activity would be unlawful.
All content is of a general nature and may not address the specific circumstances of any individual or entity. It is not a substitute for professional advice or services. Any actions you take based on the information provided here are strictly at your own risk. You accept full responsibility for any decisions or outcomes arising from your use of this website and agree to release us from any liability in connection with your use of, or reliance upon, the content or products found herein.