
|
Shanghai Weaver Network Co., Ltd. (603039.SS) Avaliação DCF |
Totalmente Editável: Adapte-Se Às Suas Necessidades No Excel Ou Planilhas
Design Profissional: Modelos Confiáveis E Padrão Da Indústria
Pré-Construídos Para Uso Rápido E Eficiente
Compatível com MAC/PC, totalmente desbloqueado
Não É Necessária Experiência; Fácil De Seguir
Shanghai Weaver Network Co., Ltd. (603039.SS) Bundle
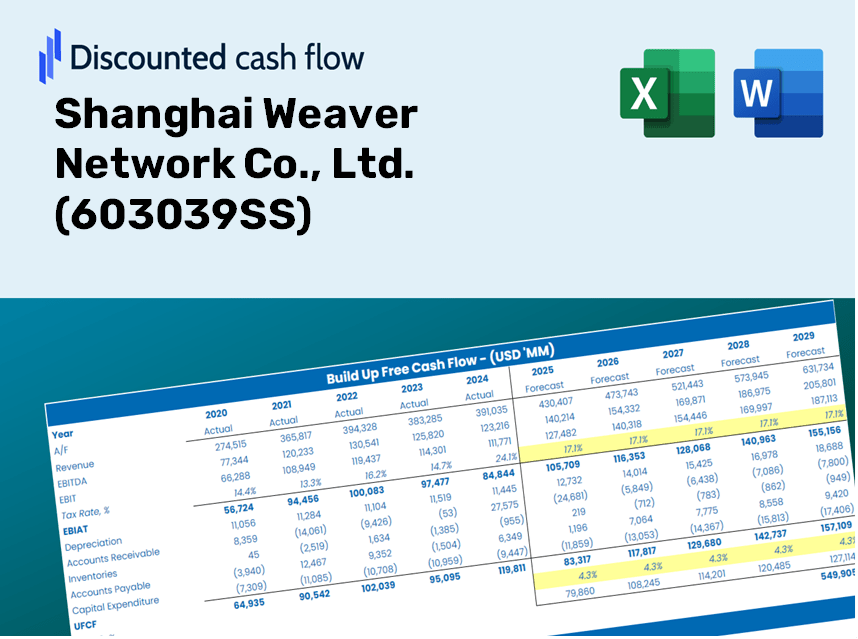
Simplifique a avaliação de Shanghai Weaver Network Co., Ltd. (603039SS) com esta calculadora DCF personalizável! Apresentando a Real Shanghai Weaver Network Co., Ltd. (603039SS) e insumos de previsão ajustáveis, você pode testar cenários e descobrir o valor justo Shanghai Weaver Network Co., Ltd. (603039Ss) em minutos.
Discounted Cash Flow (DCF) - (USD MM)
| Year | AY1 2020 |
AY2 2021 |
AY3 2022 |
AY4 2023 |
AY5 2024 |
FY1 2025 |
FY2 2026 |
FY3 2027 |
FY4 2028 |
FY5 2029 |
|---|---|---|---|---|---|---|---|---|---|---|
| Revenue | 1,482.4 | 2,002.9 | 2,331.5 | 2,393.2 | 2,361.8 | 2,673.9 | 3,027.2 | 3,427.2 | 3,880.0 | 4,392.7 |
| Revenue Growth, % | 0 | 35.11 | 16.41 | 2.65 | -1.31 | 13.21 | 13.21 | 13.21 | 13.21 | 13.21 |
| EBITDA | 178.0 | 252.2 | 235.1 | 188.4 | 234.8 | 280.8 | 317.9 | 359.9 | 407.4 | 461.2 |
| EBITDA, % | 12.01 | 12.59 | 10.08 | 7.87 | 9.94 | 10.5 | 10.5 | 10.5 | 10.5 | 10.5 |
| Depreciation | 14.1 | 14.7 | 16.2 | 24.2 | 26.8 | 24.2 | 27.4 | 31.1 | 35.2 | 39.8 |
| Depreciation, % | 0.95452 | 0.73464 | 0.69344 | 1.01 | 1.14 | 0.90639 | 0.90639 | 0.90639 | 0.90639 | 0.90639 |
| EBIT | 163.9 | 237.5 | 218.9 | 164.2 | 208.0 | 256.5 | 290.4 | 328.8 | 372.2 | 421.4 |
| EBIT, % | 11.06 | 11.86 | 9.39 | 6.86 | 8.8 | 9.59 | 9.59 | 9.59 | 9.59 | 9.59 |
| Total Cash | 1,634.6 | 2,048.5 | 2,075.2 | 2,363.7 | 1,583.9 | 2,432.4 | 2,753.8 | 3,117.6 | 3,529.5 | 3,995.9 |
| Total Cash, percent | .0 | .0 | .0 | .0 | .0 | .0 | .0 | .0 | .0 | .0 |
| Account Receivables | 180.1 | 257.7 | 327.0 | 365.7 | 371.7 | 374.6 | 424.1 | 480.2 | 543.6 | 615.5 |
| Account Receivables, % | 12.15 | 12.87 | 14.02 | 15.28 | 15.74 | 14.01 | 14.01 | 14.01 | 14.01 | 14.01 |
| Inventories | 17.7 | 55.6 | 64.2 | 68.0 | 63.1 | 65.4 | 74.1 | 83.9 | 95.0 | 107.5 |
| Inventories, % | 1.2 | 2.77 | 2.75 | 2.84 | 2.67 | 2.45 | 2.45 | 2.45 | 2.45 | 2.45 |
| Accounts Payable | 311.7 | 458.6 | 489.1 | 552.7 | 597.9 | 606.0 | 686.0 | 776.7 | 879.3 | 995.5 |
| Accounts Payable, % | 21.03 | 22.9 | 20.98 | 23.09 | 25.32 | 22.66 | 22.66 | 22.66 | 22.66 | 22.66 |
| Capital Expenditure | -67.3 | -80.1 | -126.3 | -116.1 | -91.1 | -121.2 | -137.2 | -155.4 | -175.9 | -199.1 |
| Capital Expenditure, % | -4.54 | -4 | -5.42 | -4.85 | -3.86 | -4.53 | -4.53 | -4.53 | -4.53 | -4.53 |
| Tax Rate, % | 4.88 | 4.88 | 4.88 | 4.88 | 4.88 | 4.88 | 4.88 | 4.88 | 4.88 | 4.88 |
| EBITAT | 150.7 | 218.9 | 209.2 | 169.8 | 197.8 | 243.6 | 275.8 | 312.2 | 353.5 | 400.2 |
| Depreciation | ||||||||||
| Changes in Account Receivables | ||||||||||
| Changes in Inventories | ||||||||||
| Changes in Accounts Payable | ||||||||||
| Capital Expenditure | ||||||||||
| UFCF | 211.5 | 184.9 | 51.7 | 98.9 | 177.7 | 149.3 | 187.9 | 212.8 | 240.9 | 272.7 |
| WACC, % | 6.02 | 6.02 | 6.02 | 6.02 | 6.02 | 6.02 | 6.02 | 6.02 | 6.02 | 6.02 |
| PV UFCF | ||||||||||
| SUM PV UFCF | 880.7 | |||||||||
| Long Term Growth Rate, % | 3.50 | |||||||||
| Free cash flow (T + 1) | 282 | |||||||||
| Terminal Value | 11,192 | |||||||||
| Present Terminal Value | 8,355 | |||||||||
| Enterprise Value | 9,236 | |||||||||
| Net Debt | -623 | |||||||||
| Equity Value | 9,859 | |||||||||
| Diluted Shares Outstanding, MM | 260 | |||||||||
| Equity Value Per Share | 37.89 |
What Awaits You
- Comprehensive Financial Model: Leverage Shanghai Weaver Network’s actual data for accurate DCF valuation.
- Complete Forecast Flexibility: Modify revenue growth, profit margins, WACC, and other crucial factors.
- Real-Time Calculations: Automatic updates provide instant feedback as you adjust inputs.
- Professional Template: A polished Excel file crafted for high-quality valuation.
- Adaptable and Reusable: Designed for adaptability, allowing for ongoing use in detailed forecasting.
Key Features
- 🔍 Real-Life SHW Financials: Pre-filled historical and projected data for Shanghai Weaver Network Co., Ltd. (603039SS).
- ✏️ Fully Customizable Inputs: Adjust all critical parameters (yellow cells) including WACC, growth %, and tax rates.
- 📊 Professional DCF Valuation: Integrated formulas compute the intrinsic value of Shanghai Weaver Network using the Discounted Cash Flow method.
- ⚡ Instant Results: Easily visualize the company's valuation immediately after making adjustments.
- Scenario Analysis: Evaluate and compare outcomes for different financial assumptions side-by-side.
How It Works
- 1. Access the Template: Download and open the Excel file featuring Shanghai Weaver Network Co., Ltd.'s preloaded data.
- 2. Adjust Assumptions: Modify crucial inputs such as growth rates, WACC, and capital expenditures.
- 3. View Instant Results: The DCF model automatically calculates the intrinsic value and NPV.
- 4. Explore Scenarios: Evaluate various forecasts to assess different valuation outcomes.
- 5. Utilize with Confidence: Present expert valuation insights to enhance your decision-making process.
Why Choose This Calculator for Shanghai Weaver Network Co., Ltd. (603039SS)?
- All-in-One Solution: Combines DCF, WACC, and financial ratio assessments in a single tool.
- Flexible Customization: Modify the yellow-highlighted cells to explore different financial scenarios.
- In-Depth Analysis: Automatically computes Shanghai Weaver's intrinsic value and Net Present Value.
- Data Ready: Comes with historical and projected data to provide reliable starting points.
- Designed for Professionals: Perfect for financial analysts, investors, and business advisors.
Who Can Benefit from This Product?
- Investors: Effectively assess the fair value of Shanghai Weaver Network Co., Ltd. (603039SS) prior to making investment choices.
- CFOs: Utilize a top-tier DCF model for comprehensive financial analysis and reporting.
- Consultants: Seamlessly customize the template for client valuation reports.
- Entrepreneurs: Acquire knowledge about financial modeling techniques employed by leading firms.
- Educators: Implement it as a resource to illustrate various valuation methods in teaching.
Contents of the Template
- Comprehensive DCF Model: An editable template featuring detailed valuation calculations.
- Real-World Data: Shanghai Weaver Network Co., Ltd. (603039SS) historical and projected financials preloaded for your analysis.
- Customizable Parameters: Modify WACC, growth rates, and tax assumptions to explore various scenarios.
- Financial Statements: Complete annual and quarterly financial breakdowns for enhanced insights.
- Key Ratios: Integrated analysis tools for assessing profitability, efficiency, and leverage.
- Dashboard with Visual Outputs: Charts and tables designed to provide clear, actionable results.
Disclaimer
All information, articles, and product details provided on this website are for general informational and educational purposes only. We do not claim any ownership over, nor do we intend to infringe upon, any trademarks, copyrights, logos, brand names, or other intellectual property mentioned or depicted on this site. Such intellectual property remains the property of its respective owners, and any references here are made solely for identification or informational purposes, without implying any affiliation, endorsement, or partnership.
We make no representations or warranties, express or implied, regarding the accuracy, completeness, or suitability of any content or products presented. Nothing on this website should be construed as legal, tax, investment, financial, medical, or other professional advice. In addition, no part of this site—including articles or product references—constitutes a solicitation, recommendation, endorsement, advertisement, or offer to buy or sell any securities, franchises, or other financial instruments, particularly in jurisdictions where such activity would be unlawful.
All content is of a general nature and may not address the specific circumstances of any individual or entity. It is not a substitute for professional advice or services. Any actions you take based on the information provided here are strictly at your own risk. You accept full responsibility for any decisions or outcomes arising from your use of this website and agree to release us from any liability in connection with your use of, or reliance upon, the content or products found herein.