
|
Jinneng Science & Techology Co., Ltd (603113.SS) Avaliação DCF |
Totalmente Editável: Adapte-Se Às Suas Necessidades No Excel Ou Planilhas
Design Profissional: Modelos Confiáveis E Padrão Da Indústria
Pré-Construídos Para Uso Rápido E Eficiente
Compatível com MAC/PC, totalmente desbloqueado
Não É Necessária Experiência; Fácil De Seguir
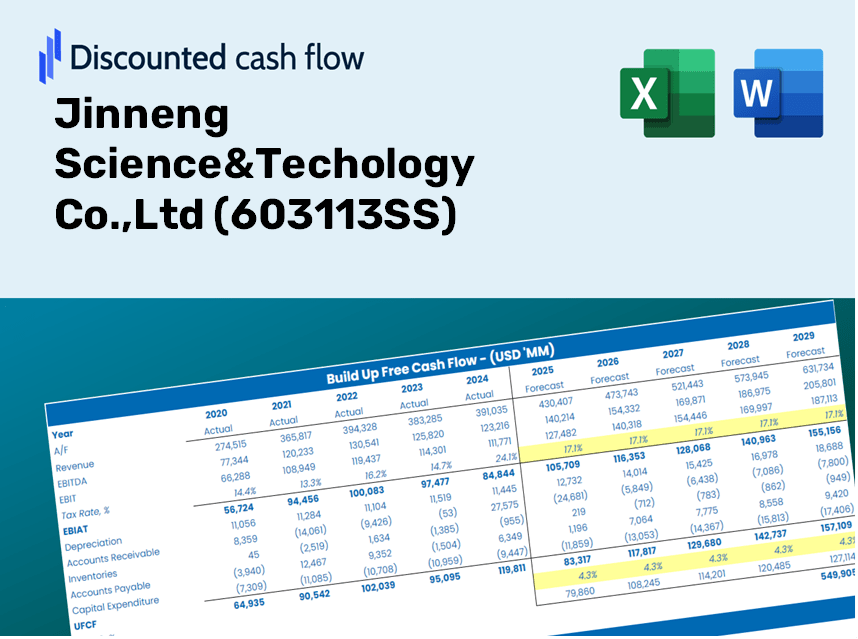
Jinneng Science&Techology Co.,Ltd (603113.SS) Bundle
Atualize sua análise e melhore a precisão com a calculadora DCF (603113SS)! Equipado com dados reais da Jinneng Science & Technology Co., LTD e suposições personalizáveis, essa ferramenta o capacita a prever, analisar e avaliar Jinneng como um investidor experiente.
Discounted Cash Flow (DCF) - (USD MM)
| Year | AY1 2020 |
AY2 2021 |
AY3 2022 |
AY4 2023 |
AY5 2024 |
FY1 2025 |
FY2 2026 |
FY3 2027 |
FY4 2028 |
FY5 2029 |
|---|---|---|---|---|---|---|---|---|---|---|
| Revenue | 7,545.1 | 11,976.1 | 16,800.7 | 14,583.8 | 16,265.1 | 20,223.4 | 25,145.1 | 31,264.5 | 38,873.1 | 48,333.5 |
| Revenue Growth, % | 0 | 58.73 | 40.29 | -13.2 | 11.53 | 24.34 | 24.34 | 24.34 | 24.34 | 24.34 |
| EBITDA | 1,501.4 | 1,692.1 | 1,152.9 | 1,006.0 | 975.7 | 2,175.5 | 2,705.0 | 3,363.3 | 4,181.8 | 5,199.5 |
| EBITDA, % | 19.9 | 14.13 | 6.86 | 6.9 | 6 | 10.76 | 10.76 | 10.76 | 10.76 | 10.76 |
| Depreciation | 438.1 | 518.8 | 755.0 | 742.3 | 896.1 | 1,020.5 | 1,268.9 | 1,577.6 | 1,961.6 | 2,439.0 |
| Depreciation, % | 5.81 | 4.33 | 4.49 | 5.09 | 5.51 | 5.05 | 5.05 | 5.05 | 5.05 | 5.05 |
| EBIT | 1,063.4 | 1,173.3 | 397.9 | 263.7 | 79.7 | 1,155.0 | 1,436.1 | 1,785.6 | 2,220.2 | 2,760.5 |
| EBIT, % | 14.09 | 9.8 | 2.37 | 1.81 | 0.48971 | 5.71 | 5.71 | 5.71 | 5.71 | 5.71 |
| Total Cash | 1,895.5 | 1,997.5 | 3,007.3 | 2,349.8 | 3,733.9 | 3,995.0 | 4,967.2 | 6,176.0 | 7,679.1 | 9,547.9 |
| Total Cash, percent | .0 | .0 | .0 | .0 | .0 | .0 | .0 | .0 | .0 | .0 |
| Account Receivables | 1,219.9 | 918.8 | 2,578.7 | 3,060.0 | 2,156.2 | 2,969.9 | 3,692.7 | 4,591.4 | 5,708.8 | 7,098.1 |
| Account Receivables, % | 16.17 | 7.67 | 15.35 | 20.98 | 13.26 | 14.69 | 14.69 | 14.69 | 14.69 | 14.69 |
| Inventories | 545.9 | 1,150.6 | 1,002.5 | 1,119.5 | 1,611.9 | 1,633.9 | 2,031.5 | 2,525.9 | 3,140.6 | 3,904.9 |
| Inventories, % | 7.24 | 9.61 | 5.97 | 7.68 | 9.91 | 8.08 | 8.08 | 8.08 | 8.08 | 8.08 |
| Accounts Payable | 1,357.4 | 1,443.7 | 965.1 | 2,177.4 | 2,423.6 | 2,654.2 | 3,300.1 | 4,103.3 | 5,101.8 | 6,343.4 |
| Accounts Payable, % | 17.99 | 12.06 | 5.74 | 14.93 | 14.9 | 13.12 | 13.12 | 13.12 | 13.12 | 13.12 |
| Capital Expenditure | -2,397.7 | -1,437.1 | -1,750.6 | -2,216.7 | -486.8 | -2,928.0 | -3,640.5 | -4,526.5 | -5,628.1 | -6,997.8 |
| Capital Expenditure, % | -31.78 | -12 | -10.42 | -15.2 | -2.99 | -14.48 | -14.48 | -14.48 | -14.48 | -14.48 |
| Tax Rate, % | 35.7 | 35.7 | 35.7 | 35.7 | 35.7 | 35.7 | 35.7 | 35.7 | 35.7 | 35.7 |
| EBITAT | 898.8 | 954.1 | 403.6 | 417.9 | 51.2 | 993.6 | 1,235.5 | 1,536.1 | 1,910.0 | 2,374.8 |
| Depreciation | ||||||||||
| Changes in Account Receivables | ||||||||||
| Changes in Inventories | ||||||||||
| Changes in Accounts Payable | ||||||||||
| Capital Expenditure | ||||||||||
| UFCF | -1,469.3 | -181.4 | -2,582.5 | -442.5 | 1,118.1 | -1,519.0 | -1,610.7 | -2,002.7 | -2,490.1 | -3,096.0 |
| WACC, % | 5.86 | 5.8 | 6.13 | 6.13 | 5.5 | 5.89 | 5.89 | 5.89 | 5.89 | 5.89 |
| PV UFCF | ||||||||||
| SUM PV UFCF | -8,865.1 | |||||||||
| Long Term Growth Rate, % | 2.00 | |||||||||
| Free cash flow (T + 1) | -3,158 | |||||||||
| Terminal Value | -81,274 | |||||||||
| Present Terminal Value | -61,061 | |||||||||
| Enterprise Value | -69,926 | |||||||||
| Net Debt | 2,231 | |||||||||
| Equity Value | -72,157 | |||||||||
| Diluted Shares Outstanding, MM | 899 | |||||||||
| Equity Value Per Share | -80.30 |
Benefits You Will Receive
- Adjustable Forecast Parameters: Easily modify assumptions (growth %, margins, WACC) to generate various scenarios.
- Accurate Financial Data: Jinneng Science & Technology Co., Ltd’s financial figures pre-loaded to kickstart your analysis.
- Instant DCF Calculations: The template automatically computes Net Present Value (NPV) and intrinsic value for your convenience.
- Tailored and Professional Design: A sleek Excel model that can be customized to meet your valuation requirements.
- Designed for Analysts and Investors: Perfect for evaluating projections, confirming strategies, and optimizing efficiency.
Core Capabilities
- Accurate Jinneng Financials: Gain access to precise historical data and forward-looking projections.
- Tailored Forecast Assumptions: Modify the highlighted fields for parameters such as WACC, growth rates, and profit margins.
- Interactive Calculations: Real-time updates for DCF, Net Present Value (NPV), and cash flow analyses.
- Insightful Dashboard: User-friendly charts and summaries to help visualize your valuation outcomes.
- Designed for All Skill Levels: An intuitive design suited for investors, CFOs, and consultants alike.
How It Works for Jinneng Science & Technology Co., Ltd (603113SS)
- 1. Access the Template: Download and open the Excel file featuring Jinneng's preloaded financial data.
- 2. Customize Inputs: Adjust critical variables such as growth rates, WACC, and capital expenditure figures.
- 3. View Instant Results: The DCF model automatically computes the intrinsic value and NPV based on your inputs.
- 4. Explore Different Scenarios: Analyze various forecasts to evaluate diverse valuation possibilities.
- 5. Present with Assurance: Share professional valuation insights to enhance your decision-making process.
Why Opt for Jinneng's Calculator?
- Precision: Utilizes Jinneng's authentic financial data for reliable results.
- Customization: Engineered for users to easily adjust and test various inputs.
- Efficiency: Avoid the complexities of creating a DCF model from the ground up.
- Expert-Level: Crafted with the accuracy and ease of use that CFOs expect.
- Intuitive Design: Simple to navigate, making it accessible for users with any level of financial expertise.
Who Can Benefit from This Product?
- Investors: Accurately assess the fair value of Jinneng Science & Technology Co., Ltd (603113SS) before making investment choices.
- CFOs: Utilize a professional-grade DCF model for comprehensive financial reporting and analysis.
- Consultants: Efficiently tailor the template for valuation reports catered to your clients.
- Entrepreneurs: Discover valuable insights into financial modeling techniques employed by top-tier companies.
- Educators: Employ this tool to teach and illustrate various valuation methodologies effectively.
Contents of the Template
- Pre-Filled Data: Features Jinneng Science & Technology Co., Ltd's historical financials and future projections.
- Discounted Cash Flow Model: An editable DCF valuation model equipped with automatic calculation features.
- Weighted Average Cost of Capital (WACC): A dedicated worksheet for WACC calculation based on user-defined inputs.
- Key Financial Ratios: Evaluate Jinneng's profitability, operational efficiency, and leverage metrics.
- Customizable Inputs: Easily modify revenue growth rates, profit margins, and tax percentages.
- Clear Dashboard: Visualizations and tables summarizing essential valuation outcomes.
Disclaimer
All information, articles, and product details provided on this website are for general informational and educational purposes only. We do not claim any ownership over, nor do we intend to infringe upon, any trademarks, copyrights, logos, brand names, or other intellectual property mentioned or depicted on this site. Such intellectual property remains the property of its respective owners, and any references here are made solely for identification or informational purposes, without implying any affiliation, endorsement, or partnership.
We make no representations or warranties, express or implied, regarding the accuracy, completeness, or suitability of any content or products presented. Nothing on this website should be construed as legal, tax, investment, financial, medical, or other professional advice. In addition, no part of this site—including articles or product references—constitutes a solicitation, recommendation, endorsement, advertisement, or offer to buy or sell any securities, franchises, or other financial instruments, particularly in jurisdictions where such activity would be unlawful.
All content is of a general nature and may not address the specific circumstances of any individual or entity. It is not a substitute for professional advice or services. Any actions you take based on the information provided here are strictly at your own risk. You accept full responsibility for any decisions or outcomes arising from your use of this website and agree to release us from any liability in connection with your use of, or reliance upon, the content or products found herein.