
|
China Bester Group Telecom Co., Ltd. (603220.SS) Avaliação DCF |
Totalmente Editável: Adapte-Se Às Suas Necessidades No Excel Ou Planilhas
Design Profissional: Modelos Confiáveis E Padrão Da Indústria
Pré-Construídos Para Uso Rápido E Eficiente
Compatível com MAC/PC, totalmente desbloqueado
Não É Necessária Experiência; Fácil De Seguir
China Bester Group Telecom Co., Ltd. (603220.SS) Bundle
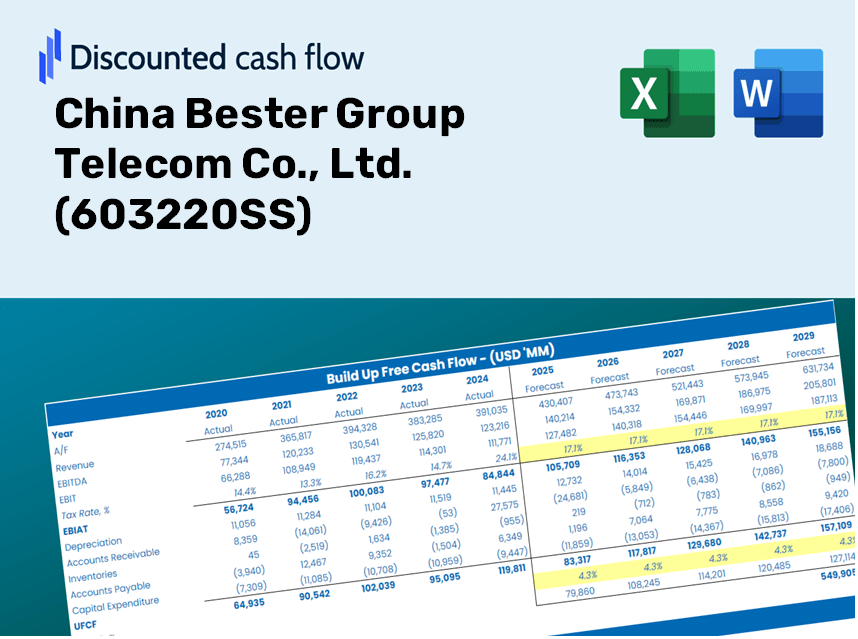
Simplifique a avaliação da China Bester Group Telecom Co., Ltd. (603220SS) com esta calculadora DCF personalizável! Com o Real China Bester Group Telecom Co., Ltd. (603220SS) e insumos de previsão ajustáveis, você pode testar cenários e descobrir o valor justo do China Bester Group Telecom Co., Ltd. (603220s) em minutos.
Benefits You'll Enjoy
- Flexible Forecast Parameters: Effortlessly modify key assumptions (growth %, profit margins, WACC) to explore various scenarios.
- Comprehensive Market Data: Pre-filled financial data for China Bester Group Telecom Co., Ltd. (603220SS) to accelerate your analytical process.
- Instant DCF Calculations: The model automatically computes Net Present Value (NPV) and intrinsic value for your convenience.
- Sleek and Adaptable Design: A refined Excel model tailored to meet your valuation requirements.
- Designed for Analysts and Investors: Perfect for evaluating forecasts, confirming strategies, and enhancing productivity.
Key Features
- 🔍 Real-Life (603220SS) Financials: Pre-filled historical and projected data for China Bester Group Telecom Co., Ltd.
- ✏️ Fully Customizable Inputs: Modify all essential parameters (yellow cells) such as WACC, growth %, and tax rates.
- 📊 Professional DCF Valuation: Integrated formulas to calculate the intrinsic value of China Bester Group Telecom using the Discounted Cash Flow method.
- ⚡ Instant Results: Visualize the valuation of China Bester Group Telecom immediately after adjustments.
- Scenario Analysis: Evaluate and compare outcomes for different financial assumptions side-by-side.
How It Functions
- Download: Obtain the pre-prepared Excel file containing China Bester Group Telecom Co., Ltd.'s financial data.
- Customize: Modify forecasts such as revenue growth, EBITDA percentage, and WACC.
- Update Automatically: The intrinsic value and NPV calculations refresh in real-time.
- Test Scenarios: Generate various projections and instantly compare the results.
- Make Decisions: Utilize the valuation outcomes to inform your investment approach.
Why Choose This Calculator for China Bester Group Telecom Co., Ltd. (603220SS)?
- Precision: Leveraging genuine financial data from China Bester ensures reliable output.
- Versatility: Built for users to experiment and adjust their inputs effortlessly.
- Efficiency: Eliminate the complexities of constructing a DCF model from the ground up.
- High-Quality Standards: Crafted with the expertise and accuracy expected at the CFO level.
- Intuitive Design: Simple to navigate, even for those new to financial modeling.
Who Should Use This Product?
- Individual Investors: Gain insights to make informed choices about trading China Bester Group Telecom Co., Ltd. (603220SS) shares.
- Financial Analysts: Enhance valuation methodologies with access to comprehensive financial models tailored for the telecommunications sector.
- Consultants: Provide clients with accurate and timely valuation assessments related to China Bester Group Telecom Co., Ltd. (603220SS).
- Business Owners: Learn how telecommunications companies like China Bester Group Telecom Co., Ltd. (603220SS) are valued to inform your business decisions.
- Finance Students: Explore valuation strategies using real data and case studies from the telecom industry.
Contents of the Template
- Operating and Balance Sheet Data: Pre-filled historical data and forecasts for China Bester Group Telecom Co., Ltd. (603220SS), covering metrics such as revenue, EBITDA, EBIT, and capital expenditures.
- WACC Calculation: A dedicated worksheet for calculating Weighted Average Cost of Capital (WACC), featuring key parameters like Beta, risk-free rate, and share price.
- DCF Valuation (Unlevered and Levered): Customizable Discounted Cash Flow models that reveal intrinsic value with comprehensive calculations.
- Financial Statements: Pre-loaded annual and quarterly financial statements to aid in analysis.
- Key Ratios: Provides a set of profitability, leverage, and efficiency ratios for China Bester Group Telecom Co., Ltd. (603220SS).
- Dashboard and Charts: A visual overview of valuation outputs and assumptions to simplify result analysis.
Disclaimer
All information, articles, and product details provided on this website are for general informational and educational purposes only. We do not claim any ownership over, nor do we intend to infringe upon, any trademarks, copyrights, logos, brand names, or other intellectual property mentioned or depicted on this site. Such intellectual property remains the property of its respective owners, and any references here are made solely for identification or informational purposes, without implying any affiliation, endorsement, or partnership.
We make no representations or warranties, express or implied, regarding the accuracy, completeness, or suitability of any content or products presented. Nothing on this website should be construed as legal, tax, investment, financial, medical, or other professional advice. In addition, no part of this site—including articles or product references—constitutes a solicitation, recommendation, endorsement, advertisement, or offer to buy or sell any securities, franchises, or other financial instruments, particularly in jurisdictions where such activity would be unlawful.
All content is of a general nature and may not address the specific circumstances of any individual or entity. It is not a substitute for professional advice or services. Any actions you take based on the information provided here are strictly at your own risk. You accept full responsibility for any decisions or outcomes arising from your use of this website and agree to release us from any liability in connection with your use of, or reliance upon, the content or products found herein.