
|
Shenzhen Kinwong Electronic Co., Ltd. (603228.SS) DCF Avaliação |
Totalmente Editável: Adapte-Se Às Suas Necessidades No Excel Ou Planilhas
Design Profissional: Modelos Confiáveis E Padrão Da Indústria
Pré-Construídos Para Uso Rápido E Eficiente
Compatível com MAC/PC, totalmente desbloqueado
Não É Necessária Experiência; Fácil De Seguir
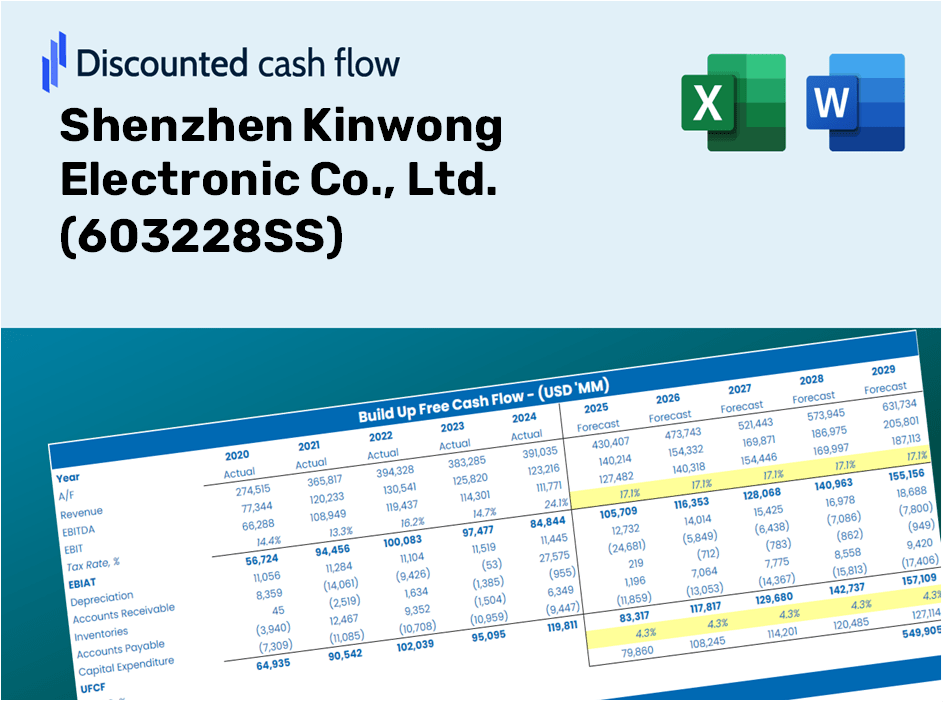
Shenzhen Kinwong Electronic Co., Ltd. (603228.SS) Bundle
Avalie as perspectivas financeiras da Shenzhen Kinwong Electronic Co., Ltd. como um especialista! Esta (6032228SS) calculadora DCF vem com dados financeiros pré-preenchidos e oferece total flexibilidade para modificar o crescimento da receita, o WACC, as margens e outras suposições essenciais para se alinhar às suas projeções.
Discounted Cash Flow (DCF) - (USD MM)
| Year | AY1 2020 |
AY2 2021 |
AY3 2022 |
AY4 2023 |
AY5 2024 |
FY1 2025 |
FY2 2026 |
FY3 2027 |
FY4 2028 |
FY5 2029 |
|---|---|---|---|---|---|---|---|---|---|---|
| Revenue | 7,063.6 | 9,532.4 | 10,514.0 | 10,757.3 | 12,659.4 | 14,724.3 | 17,126.0 | 19,919.4 | 23,168.5 | 26,947.5 |
| Revenue Growth, % | 0 | 34.95 | 10.3 | 2.31 | 17.68 | 16.31 | 16.31 | 16.31 | 16.31 | 16.31 |
| EBITDA | 1,342.4 | 1,452.2 | 1,717.8 | 1,829.0 | 1,975.8 | 2,449.7 | 2,849.3 | 3,314.0 | 3,854.6 | 4,483.3 |
| EBITDA, % | 19 | 15.23 | 16.34 | 17 | 15.61 | 16.64 | 16.64 | 16.64 | 16.64 | 16.64 |
| Depreciation | 328.3 | 404.6 | 617.7 | 723.3 | 744.4 | 806.0 | 937.5 | 1,090.4 | 1,268.3 | 1,475.2 |
| Depreciation, % | 4.65 | 4.24 | 5.88 | 6.72 | 5.88 | 5.47 | 5.47 | 5.47 | 5.47 | 5.47 |
| EBIT | 1,014.1 | 1,047.6 | 1,100.1 | 1,105.7 | 1,231.4 | 1,643.7 | 1,911.8 | 2,223.6 | 2,586.3 | 3,008.2 |
| EBIT, % | 14.36 | 10.99 | 10.46 | 10.28 | 9.73 | 11.16 | 11.16 | 11.16 | 11.16 | 11.16 |
| Total Cash | 3,088.5 | 1,456.4 | 1,508.1 | 2,537.8 | 2,495.7 | 3,435.2 | 3,995.5 | 4,647.3 | 5,405.3 | 6,287.0 |
| Total Cash, percent | .0 | .0 | .0 | .0 | .0 | .0 | .0 | .0 | .0 | .0 |
| Account Receivables | 3,137.2 | 4,178.3 | 4,438.5 | 4,787.6 | 5,194.1 | 6,360.8 | 7,398.3 | 8,605.1 | 10,008.6 | 11,641.2 |
| Account Receivables, % | 44.41 | 43.83 | 42.22 | 44.51 | 41.03 | 43.2 | 43.2 | 43.2 | 43.2 | 43.2 |
| Inventories | 877.5 | 1,444.1 | 1,375.5 | 1,364.0 | 1,742.4 | 1,976.0 | 2,298.3 | 2,673.2 | 3,109.2 | 3,616.3 |
| Inventories, % | 12.42 | 15.15 | 13.08 | 12.68 | 13.76 | 13.42 | 13.42 | 13.42 | 13.42 | 13.42 |
| Accounts Payable | 2,861.5 | 4,282.9 | 3,857.4 | 3,913.0 | 3,588.5 | 5,502.5 | 6,400.0 | 7,443.9 | 8,658.1 | 10,070.4 |
| Accounts Payable, % | 40.51 | 44.93 | 36.69 | 36.38 | 28.35 | 37.37 | 37.37 | 37.37 | 37.37 | 37.37 |
| Capital Expenditure | -1,876.6 | -2,385.0 | -1,888.2 | -1,450.7 | -1,846.5 | -2,874.7 | -3,343.6 | -3,889.0 | -4,523.3 | -5,261.1 |
| Capital Expenditure, % | -26.57 | -25.02 | -17.96 | -13.49 | -14.59 | -19.52 | -19.52 | -19.52 | -19.52 | -19.52 |
| Tax Rate, % | 11.47 | 11.47 | 11.47 | 11.47 | 11.47 | 11.47 | 11.47 | 11.47 | 11.47 | 11.47 |
| EBITAT | 886.4 | 939.7 | 956.6 | 988.2 | 1,090.2 | 1,452.9 | 1,689.9 | 1,965.5 | 2,286.1 | 2,659.0 |
| Depreciation | ||||||||||
| Changes in Account Receivables | ||||||||||
| Changes in Inventories | ||||||||||
| Changes in Accounts Payable | ||||||||||
| Capital Expenditure | ||||||||||
| UFCF | -1,815.1 | -1,227.1 | -931.0 | -21.2 | -1,121.3 | -102.1 | -1,178.5 | -1,370.7 | -1,594.3 | -1,854.4 |
| WACC, % | 6.62 | 6.63 | 6.62 | 6.63 | 6.63 | 6.63 | 6.63 | 6.63 | 6.63 | 6.63 |
| PV UFCF | ||||||||||
| SUM PV UFCF | -4,841.9 | |||||||||
| Long Term Growth Rate, % | 3.00 | |||||||||
| Free cash flow (T + 1) | -1,910 | |||||||||
| Terminal Value | -52,670 | |||||||||
| Present Terminal Value | -38,216 | |||||||||
| Enterprise Value | -43,058 | |||||||||
| Net Debt | 1,167 | |||||||||
| Equity Value | -44,225 | |||||||||
| Diluted Shares Outstanding, MM | 872 | |||||||||
| Equity Value Per Share | -50.69 |
Benefits You Will Receive
- Customizable Excel Template: A fully adaptable Excel-based DCF Calculator featuring pre-filled financials from Shenzhen Kinwong Electronic Co., Ltd. (603228SS).
- Real-World Insights: Access to historical data and forward-looking projections (highlighted in the yellow cells).
- Flexible Forecasting: Adjust assumptions for key metrics such as revenue growth, EBITDA %, and WACC.
- Instant Calculations: Quickly assess how your inputs affect the valuation of Shenzhen Kinwong Electronic Co., Ltd. (603228SS).
- Professional Resource: Designed for investors, CFOs, consultants, and financial analysts.
- User-Friendly Interface: Organized for simplicity and ease of navigation, complete with step-by-step guidance.
Key Features
- 🔍 Real-Life KWE Financials: Pre-filled historical and projected data for Shenzhen Kinwong Electronic Co., Ltd. (603228SS).
- ✏️ Fully Customizable Inputs: Modify all essential parameters (yellow cells) such as WACC, growth %, and tax rates.
- 📊 Professional DCF Valuation: Utilizes built-in formulas to determine the intrinsic value of Shenzhen Kinwong using the Discounted Cash Flow method.
- ⚡ Instant Results: Quickly visualize the valuation of Shenzhen Kinwong as you make adjustments.
- Scenario Analysis: Evaluate and compare the impacts of different financial assumptions side-by-side.
How It Operates
- 1. Access the Template: Download and open the Excel file featuring Shenzhen Kinwong Electronic Co., Ltd.'s preloaded data.
- 2. Modify Assumptions: Adjust essential inputs such as growth rates, WACC, and capital expenditures.
- 3. See Instant Results: The DCF model automatically calculates intrinsic value and NPV in real-time.
- 4. Evaluate Scenarios: Analyze various forecasts to explore different valuation possibilities.
- 5. Present with Assurance: Deliver professional valuation insights to back your strategic decisions.
Why Choose Shenzhen Kinwong Electronic Co., Ltd. (603228SS)?
- All-in-One Solution: Offers a comprehensive suite of financial tools, including DCF, WACC, and financial ratio analyses.
- Flexible Parameters: Modify the highlighted fields to explore different scenarios and outcomes.
- In-Depth Analysis: Automatically computes the intrinsic value and Net Present Value for Shenzhen Kinwong Electronic Co., Ltd. (603228SS).
- Rich Data Repository: Access to historical and projected data for reliable baseline analysis.
- Top-Notch Standards: Perfect for financial analysts, investors, and business consultants alike.
Who Can Benefit from Our Products?
- Electronics Manufacturers: Leverage our precision components to enhance product quality and reliability.
- Design Engineers: Streamline your workflow with our innovative solutions tailored for efficient design processes.
- Contractors: Utilize our reliable parts for swift assembly and installation in various projects.
- Technology Enthusiasts: Gain insight into cutting-edge electronic solutions and their applications in the industry.
- Students and Educators: Employ our resources for hands-on learning in electronics and engineering courses.
Contents of the Template
- Historical Data: Includes Shenzhen Kinwong Electronic Co., Ltd.'s past financials and baseline forecasts.
- DCF and Levered DCF Models: Comprehensive templates for calculating the intrinsic value of Shenzhen Kinwong Electronic Co., Ltd. (603228SS).
- WACC Sheet: Pre-structured calculations for Weighted Average Cost of Capital.
- Editable Inputs: Customize key drivers such as growth rates, EBITDA percentages, and CAPEX assumptions.
- Quarterly and Annual Statements: A thorough breakdown of Shenzhen Kinwong Electronic Co., Ltd.'s financials.
- Interactive Dashboard: Dynamically visualize valuation results and forecasts.
Disclaimer
All information, articles, and product details provided on this website are for general informational and educational purposes only. We do not claim any ownership over, nor do we intend to infringe upon, any trademarks, copyrights, logos, brand names, or other intellectual property mentioned or depicted on this site. Such intellectual property remains the property of its respective owners, and any references here are made solely for identification or informational purposes, without implying any affiliation, endorsement, or partnership.
We make no representations or warranties, express or implied, regarding the accuracy, completeness, or suitability of any content or products presented. Nothing on this website should be construed as legal, tax, investment, financial, medical, or other professional advice. In addition, no part of this site—including articles or product references—constitutes a solicitation, recommendation, endorsement, advertisement, or offer to buy or sell any securities, franchises, or other financial instruments, particularly in jurisdictions where such activity would be unlawful.
All content is of a general nature and may not address the specific circumstances of any individual or entity. It is not a substitute for professional advice or services. Any actions you take based on the information provided here are strictly at your own risk. You accept full responsibility for any decisions or outcomes arising from your use of this website and agree to release us from any liability in connection with your use of, or reliance upon, the content or products found herein.