
|
Fujian Apex Software Co., Ltd (603383.SS) Avaliação DCF |
Totalmente Editável: Adapte-Se Às Suas Necessidades No Excel Ou Planilhas
Design Profissional: Modelos Confiáveis E Padrão Da Indústria
Pré-Construídos Para Uso Rápido E Eficiente
Compatível com MAC/PC, totalmente desbloqueado
Não É Necessária Experiência; Fácil De Seguir
Fujian Apex Software Co.,LTD (603383.SS) Bundle
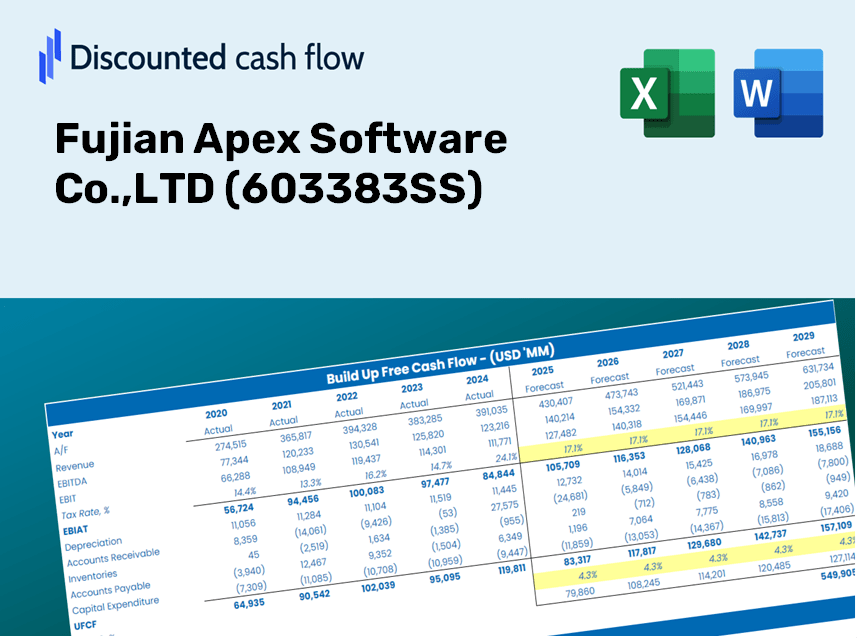
Explore as perspectivas financeiras da Fujian Apex Software Co., Ltd com nossa calculadora DCF amigável! Digite suas suposições de crescimento, margens e custos para calcular o valor intrínseco da Fujian Apex Software Co., Ltd e aprimorar sua estratégia de investimento.
Discounted Cash Flow (DCF) - (USD MM)
| Year | AY1 2020 |
AY2 2021 |
AY3 2022 |
AY4 2023 |
AY5 2024 |
FY1 2025 |
FY2 2026 |
FY3 2027 |
FY4 2028 |
FY5 2029 |
|---|---|---|---|---|---|---|---|---|---|---|
| Revenue | 350.0 | 502.9 | 624.6 | 743.9 | 663.7 | 790.2 | 940.7 | 1,119.9 | 1,333.2 | 1,587.2 |
| Revenue Growth, % | 0 | 43.68 | 24.19 | 19.1 | -10.78 | 19.05 | 19.05 | 19.05 | 19.05 | 19.05 |
| EBITDA | 89.2 | 131.6 | 156.1 | 229.3 | 178.8 | 212.4 | 252.9 | 301.0 | 358.4 | 426.7 |
| EBITDA, % | 25.48 | 26.17 | 24.99 | 30.83 | 26.95 | 26.88 | 26.88 | 26.88 | 26.88 | 26.88 |
| Depreciation | 6.9 | 10.3 | 10.9 | 11.2 | 8.4 | 13.5 | 16.1 | 19.2 | 22.8 | 27.2 |
| Depreciation, % | 1.98 | 2.05 | 1.75 | 1.51 | 1.26 | 1.71 | 1.71 | 1.71 | 1.71 | 1.71 |
| EBIT | 82.2 | 121.3 | 145.1 | 218.1 | 170.5 | 198.9 | 236.8 | 281.9 | 335.6 | 399.5 |
| EBIT, % | 23.5 | 24.12 | 23.24 | 29.31 | 25.69 | 25.17 | 25.17 | 25.17 | 25.17 | 25.17 |
| Total Cash | 934.7 | 1,290.0 | 1,399.9 | 1,090.1 | 1,301.2 | 790.2 | 940.7 | 1,119.9 | 1,333.2 | 1,587.2 |
| Total Cash, percent | .0 | .0 | .0 | .0 | .0 | .0 | .0 | .0 | .0 | .0 |
| Account Receivables | 25.6 | 32.5 | 55.5 | 61.9 | 53.5 | 61.7 | 73.5 | 87.5 | 104.1 | 123.9 |
| Account Receivables, % | 7.31 | 6.46 | 8.89 | 8.32 | 8.07 | 7.81 | 7.81 | 7.81 | 7.81 | 7.81 |
| Inventories | 88.3 | 117.2 | 130.4 | 132.4 | 119.1 | 166.2 | 197.8 | 235.5 | 280.4 | 333.8 |
| Inventories, % | 25.23 | 23.3 | 20.87 | 17.8 | 17.95 | 21.03 | 21.03 | 21.03 | 21.03 | 21.03 |
| Accounts Payable | 2.8 | 4.2 | 7.3 | 17.2 | 15.4 | 11.8 | 14.0 | 16.7 | 19.9 | 23.6 |
| Accounts Payable, % | 0.80357 | 0.84336 | 1.17 | 2.31 | 2.32 | 1.49 | 1.49 | 1.49 | 1.49 | 1.49 |
| Capital Expenditure | -13.3 | -11.8 | -5.2 | -37.9 | -5.8 | -20.5 | -24.4 | -29.0 | -34.6 | -41.2 |
| Capital Expenditure, % | -3.81 | -2.35 | -0.83046 | -5.1 | -0.87519 | -2.59 | -2.59 | -2.59 | -2.59 | -2.59 |
| Tax Rate, % | 2.86 | 2.86 | 2.86 | 2.86 | 2.86 | 2.86 | 2.86 | 2.86 | 2.86 | 2.86 |
| EBITAT | 79.0 | 112.6 | 138.5 | 203.9 | 165.6 | 188.9 | 224.9 | 267.8 | 318.8 | 379.5 |
| Depreciation | ||||||||||
| Changes in Account Receivables | ||||||||||
| Changes in Inventories | ||||||||||
| Changes in Accounts Payable | ||||||||||
| Capital Expenditure | ||||||||||
| UFCF | -38.4 | 76.8 | 111.0 | 178.7 | 188.0 | 123.1 | 175.5 | 208.9 | 248.7 | 296.1 |
| WACC, % | 4.53 | 4.53 | 4.53 | 4.53 | 4.53 | 4.53 | 4.53 | 4.53 | 4.53 | 4.53 |
| PV UFCF | ||||||||||
| SUM PV UFCF | 906.7 | |||||||||
| Long Term Growth Rate, % | 3.50 | |||||||||
| Free cash flow (T + 1) | 306 | |||||||||
| Terminal Value | 29,673 | |||||||||
| Present Terminal Value | 23,774 | |||||||||
| Enterprise Value | 24,680 | |||||||||
| Net Debt | -693 | |||||||||
| Equity Value | 25,374 | |||||||||
| Diluted Shares Outstanding, MM | 204 | |||||||||
| Equity Value Per Share | 124.26 |
What You Will Receive
- Customizable Spreadsheet: A fully editable Excel template featuring a DCF Calculator populated with accurate financial data for Fujian Apex Software Co., LTD (603383SS).
- Accurate Historical Insights: Access to both historical data and projected estimates (highlighted in the yellow cells).
- Adjustable Forecast Parameters: Modify assumptions for revenue growth, EBITDA percentage, and WACC to suit your analysis.
- Instant Calculation Updates: Witness the immediate effects of your adjustments on Fujian Apex Software’s valuation.
- Professional-Grade Resource: Designed for investors, CFOs, consultants, and financial analysts alike.
- Intuitive Layout: Organized for simplicity and user-friendliness, complete with detailed step-by-step guidance.
Key Features
- 🔍 Real-Life Fujian Apex Financials: Pre-filled historical and projected data for Fujian Apex Software Co.,LTD (603383SS).
- ✏️ Fully Customizable Inputs: Modify all essential parameters (yellow cells) such as WACC, growth %, and tax rates.
- 📊 Professional DCF Valuation: Integrated formulas determine the intrinsic value of Fujian Apex using the Discounted Cash Flow method.
- ⚡ Instant Results: See Fujian Apex's valuation updated immediately after making adjustments.
- Scenario Analysis: Evaluate and compare different financial assumptions side-by-side.
How It Functions
- Step 1: Download the Excel template.
- Step 2: Examine Fujian Apex Software's pre-populated financial data and projections.
- Step 3: Adjust key variables such as revenue growth, WACC, and tax rates (highlighted cells).
- Step 4: Observe the DCF model refresh in real-time as you change your inputs.
- Step 5: Review the results and leverage the findings for investment strategies.
Why Choose Fujian Apex Software Co., LTD (603383SS)?
- Time Efficient: Skip the hassle of building software solutions from the ground up – our tools are ready for immediate use.
- Enhanced Accuracy: Our reliable data and algorithms minimize the risk of errors in your software projects.
- Completely Customizable: Adjust the software to align with your unique needs and future projections.
- User-Friendly Interface: Intuitive designs and outputs make it simple to understand and analyze results.
- Preferred by Industry Leaders: Crafted for professionals who prioritize both precision and functionality.
Who Can Benefit from This Software?
- Software Developers: Enhance your skills by utilizing advanced coding frameworks and real-time data.
- Researchers: Integrate cutting-edge software models into your academic projects or studies.
- Investors: Evaluate your strategies and assess the performance of Fujian Apex Software Co.,LTD (603383SS) using our tools.
- Data Analysts: Optimize your analysis process with our intuitive and customizable software solutions.
- Entrepreneurs: Learn from the operational approaches of established tech firms like Fujian Apex Software Co.,LTD (603383SS).
Contents of the Template
- Pre-Filled DCF Model: Fujian Apex Software Co.,LTD’s financial data preloaded for immediate utilization.
- WACC Calculator: Comprehensive computations for Weighted Average Cost of Capital.
- Financial Ratios: Assess Fujian Apex’s profitability, leverage, and operational efficiency.
- Editable Inputs: Modify assumptions such as growth rates, profit margins, and capital expenditures to tailor your scenarios.
- Financial Statements: Access annual and quarterly reports for in-depth analysis.
- Interactive Dashboard: Visually represent key valuation metrics and results with ease.
Disclaimer
All information, articles, and product details provided on this website are for general informational and educational purposes only. We do not claim any ownership over, nor do we intend to infringe upon, any trademarks, copyrights, logos, brand names, or other intellectual property mentioned or depicted on this site. Such intellectual property remains the property of its respective owners, and any references here are made solely for identification or informational purposes, without implying any affiliation, endorsement, or partnership.
We make no representations or warranties, express or implied, regarding the accuracy, completeness, or suitability of any content or products presented. Nothing on this website should be construed as legal, tax, investment, financial, medical, or other professional advice. In addition, no part of this site—including articles or product references—constitutes a solicitation, recommendation, endorsement, advertisement, or offer to buy or sell any securities, franchises, or other financial instruments, particularly in jurisdictions where such activity would be unlawful.
All content is of a general nature and may not address the specific circumstances of any individual or entity. It is not a substitute for professional advice or services. Any actions you take based on the information provided here are strictly at your own risk. You accept full responsibility for any decisions or outcomes arising from your use of this website and agree to release us from any liability in connection with your use of, or reliance upon, the content or products found herein.