
|
Duolun Technology Corporation Ltd. (603528.SS) Avaliação DCF |
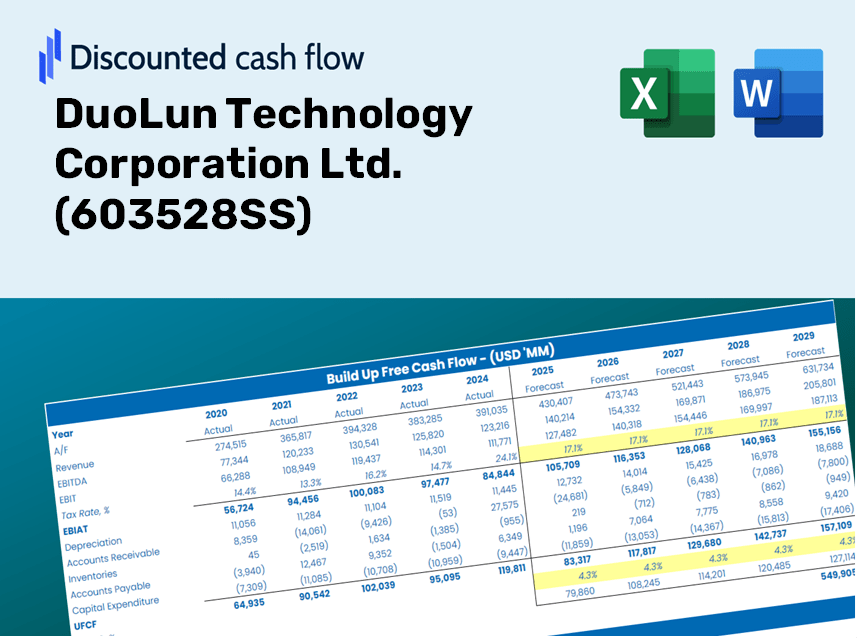
Totalmente Editável: Adapte-Se Às Suas Necessidades No Excel Ou Planilhas
Design Profissional: Modelos Confiáveis E Padrão Da Indústria
Pré-Construídos Para Uso Rápido E Eficiente
Compatível com MAC/PC, totalmente desbloqueado
Não É Necessária Experiência; Fácil De Seguir
DuoLun Technology Corporation Ltd. (603528.SS) Bundle
Atualize sua análise e melhore a precisão com a calculadora DCF (603528SS)! Utilizando dados reais da Duolun Technology Corporation Ltd. e suposições personalizáveis, essa ferramenta o capacita a prever, analisar e avaliar (603528Ss) como um investidor experiente.
Discounted Cash Flow (DCF) - (USD MM)
| Year | AY1 2020 |
AY2 2021 |
AY3 2022 |
AY4 2023 |
AY5 2024 |
FY1 2025 |
FY2 2026 |
FY3 2027 |
FY4 2028 |
FY5 2029 |
|---|---|---|---|---|---|---|---|---|---|---|
| Revenue | 635.6 | 714.7 | 739.8 | 531.4 | 522.6 | 504.5 | 487.0 | 470.2 | 453.9 | 438.1 |
| Revenue Growth, % | 0 | 12.43 | 3.52 | -28.17 | -1.65 | -3.47 | -3.47 | -3.47 | -3.47 | -3.47 |
| EBITDA | 161.7 | -32.0 | 202.9 | -82.9 | 66.5 | 45.9 | 44.3 | 42.8 | 41.3 | 39.9 |
| EBITDA, % | 25.44 | -4.48 | 27.43 | -15.59 | 12.73 | 9.1 | 9.1 | 9.1 | 9.1 | 9.1 |
| Depreciation | 57.4 | 103.0 | 119.0 | 103.8 | 93.9 | 77.7 | 75.0 | 72.4 | 69.9 | 67.5 |
| Depreciation, % | 9.04 | 14.42 | 16.08 | 19.54 | 17.96 | 15.41 | 15.41 | 15.41 | 15.41 | 15.41 |
| EBIT | 104.3 | -135.0 | 83.9 | -186.7 | -27.3 | -31.8 | -30.7 | -29.6 | -28.6 | -27.6 |
| EBIT, % | 16.4 | -18.89 | 11.34 | -35.13 | -5.23 | -6.3 | -6.3 | -6.3 | -6.3 | -6.3 |
| Total Cash | 1,235.4 | 1,034.4 | 1,126.9 | 1,109.4 | 1,145.9 | 504.5 | 487.0 | 470.2 | 453.9 | 438.1 |
| Total Cash, percent | .0 | .0 | .0 | .0 | .0 | .0 | .0 | .0 | .0 | .0 |
| Account Receivables | 376.1 | 425.6 | 423.8 | 332.0 | 333.1 | 305.0 | 294.4 | 284.2 | 274.3 | 264.8 |
| Account Receivables, % | 59.17 | 59.56 | 57.28 | 62.48 | 63.74 | 60.45 | 60.45 | 60.45 | 60.45 | 60.45 |
| Inventories | 250.5 | 227.1 | 250.3 | 193.0 | 129.4 | 167.6 | 161.8 | 156.2 | 150.8 | 145.5 |
| Inventories, % | 39.41 | 31.78 | 33.84 | 36.32 | 24.75 | 33.22 | 33.22 | 33.22 | 33.22 | 33.22 |
| Accounts Payable | 162.8 | 191.8 | 206.8 | 177.3 | 153.3 | 144.4 | 139.4 | 134.5 | 129.9 | 125.4 |
| Accounts Payable, % | 25.6 | 26.84 | 27.96 | 33.36 | 29.33 | 28.62 | 28.62 | 28.62 | 28.62 | 28.62 |
| Capital Expenditure | -124.3 | -116.9 | -51.3 | -25.8 | -46.9 | -57.2 | -55.2 | -53.3 | -51.5 | -49.7 |
| Capital Expenditure, % | -19.56 | -16.35 | -6.94 | -4.86 | -8.98 | -11.34 | -11.34 | -11.34 | -11.34 | -11.34 |
| Tax Rate, % | 116.1 | 116.1 | 116.1 | 116.1 | 116.1 | 116.1 | 116.1 | 116.1 | 116.1 | 116.1 |
| EBITAT | 90.0 | -129.2 | 89.5 | -174.8 | 4.4 | -23.9 | -23.1 | -22.3 | -21.5 | -20.7 |
| Depreciation | ||||||||||
| Changes in Account Receivables | ||||||||||
| Changes in Inventories | ||||||||||
| Changes in Accounts Payable | ||||||||||
| Capital Expenditure | ||||||||||
| UFCF | -440.8 | -140.2 | 150.8 | 22.6 | 89.9 | -22.3 | 8.1 | 7.9 | 7.6 | 7.3 |
| WACC, % | 4.78 | 4.78 | 4.79 | 4.78 | 4.7 | 4.77 | 4.77 | 4.77 | 4.77 | 4.77 |
| PV UFCF | ||||||||||
| SUM PV UFCF | 5.0 | |||||||||
| Long Term Growth Rate, % | 4.00 | |||||||||
| Free cash flow (T + 1) | 8 | |||||||||
| Terminal Value | 993 | |||||||||
| Present Terminal Value | 787 | |||||||||
| Enterprise Value | 792 | |||||||||
| Net Debt | -633 | |||||||||
| Equity Value | 1,424 | |||||||||
| Diluted Shares Outstanding, MM | 703 | |||||||||
| Equity Value Per Share | 2.03 |
What You Will Receive
- Authentic DUOL Financial Data: Pre-filled with DuoLun’s historical and projected metrics for accurate analysis.
- Completely Customizable Template: Easily adjust crucial inputs such as revenue growth, WACC, and EBITDA %.
- Instant Calculations: Watch the intrinsic value of DuoLun update in real-time based on your modifications.
- Dedicated Valuation Tool: Tailored for investors, analysts, and consultants looking for precise DCF outcomes.
- Intuitive Interface: Streamlined design with clear directions for users of all skill levels.
Key Features
- 🔍 Real-Life DuoLun Financials: Pre-filled historical and projected data for DuoLun Technology Corporation Ltd. (603528SS).
- ✏️ Fully Customizable Inputs: Adjust all essential parameters (yellow cells) such as WACC, growth %, and tax rates.
- 📊 Professional DCF Valuation: Integrated formulas compute DuoLun’s intrinsic value using the Discounted Cash Flow method.
- ⚡ Instant Results: Visualize DuoLun’s valuation immediately after making adjustments.
- Scenario Analysis: Explore and compare outcomes for different financial assumptions side-by-side.
How It Operates
- Step 1: Download the Excel file.
- Step 2: Examine DuoLun Technology Corporation Ltd.’s (603528SS) pre-filled financial data and projections.
- Step 3: Adjust key inputs such as revenue growth, WACC, and tax rates (indicated in highlighted cells).
- Step 4: Observe the DCF model update in real-time as you modify your assumptions.
- Step 5: Review the results and leverage the findings for your investment strategies.
Why Choose DuoLun Technology Corporation Ltd. (603528SS) Calculator?
- Time Efficiency: Skip the hassle of building a DCF model from the ground up – our tool is ready for immediate use.
- Enhanced Accuracy: Dependable financial data and proven formulas minimize valuation errors.
- Fully Customizable: Adjust the model to align with your unique assumptions and forecasts.
- User-Friendly Analysis: Intuitive charts and outputs simplify result interpretation.
- Expert Endorsement: Crafted for professionals who prioritize accuracy and functionality.
Who Can Benefit from This Product?
- Professional Investors: Develop comprehensive and trustworthy valuation models for analyzing portfolios involving DuoLun Technology Corporation Ltd. (603528SS).
- Corporate Finance Teams: Evaluate valuation scenarios to inform strategic decisions within the organization.
- Consultants and Advisors: Offer clients precise valuation insights related to DuoLun Technology Corporation Ltd. (603528SS).
- Students and Educators: Utilize real-world data to enhance practical skills and teaching in financial modeling.
- Tech Enthusiasts: Gain insights into the valuation processes of technology firms like DuoLun Technology Corporation Ltd. (603528SS).
Contents of the Template
- Operating and Balance Sheet Data: Pre-filled historical data and forecasts for DuoLun Technology Corporation Ltd. (603528SS), including revenue, EBITDA, EBIT, and capital expenditures.
- WACC Calculation: A dedicated sheet for calculating the Weighted Average Cost of Capital (WACC), featuring parameters such as Beta, risk-free rate, and share price.
- DCF Valuation (Unlevered and Levered): Customizable Discounted Cash Flow models that present intrinsic value along with detailed calculations.
- Financial Statements: Pre-loaded annual and quarterly financial statements to facilitate thorough analysis.
- Key Ratios: A comprehensive set of profitability, leverage, and efficiency ratios for DuoLun Technology Corporation Ltd. (603528SS).
- Dashboard and Charts: A visual overview of valuation results and assumptions for easy analysis of outcomes.
Disclaimer
All information, articles, and product details provided on this website are for general informational and educational purposes only. We do not claim any ownership over, nor do we intend to infringe upon, any trademarks, copyrights, logos, brand names, or other intellectual property mentioned or depicted on this site. Such intellectual property remains the property of its respective owners, and any references here are made solely for identification or informational purposes, without implying any affiliation, endorsement, or partnership.
We make no representations or warranties, express or implied, regarding the accuracy, completeness, or suitability of any content or products presented. Nothing on this website should be construed as legal, tax, investment, financial, medical, or other professional advice. In addition, no part of this site—including articles or product references—constitutes a solicitation, recommendation, endorsement, advertisement, or offer to buy or sell any securities, franchises, or other financial instruments, particularly in jurisdictions where such activity would be unlawful.
All content is of a general nature and may not address the specific circumstances of any individual or entity. It is not a substitute for professional advice or services. Any actions you take based on the information provided here are strictly at your own risk. You accept full responsibility for any decisions or outcomes arising from your use of this website and agree to release us from any liability in connection with your use of, or reliance upon, the content or products found herein.