
|
Zhejiang Jiecang Linear Motion Technology Co., Ltd. (603583.Ss) Avaliação do DCF |
Totalmente Editável: Adapte-Se Às Suas Necessidades No Excel Ou Planilhas
Design Profissional: Modelos Confiáveis E Padrão Da Indústria
Pré-Construídos Para Uso Rápido E Eficiente
Compatível com MAC/PC, totalmente desbloqueado
Não É Necessária Experiência; Fácil De Seguir
Zhejiang Jiecang Linear Motion Technology Co.,Ltd. (603583.SS) Bundle
Projetado para precisão, nossa calculadora DCF (603583SS) permite avaliar a Avaliação Zhejiang Jiecang Linear Motion Technology Co., Ltd. Usando dados financeiros do mundo real, juntamente com a flexibilidade completa para modificar todos os parâmetros essenciais para projeções aprimoradas.
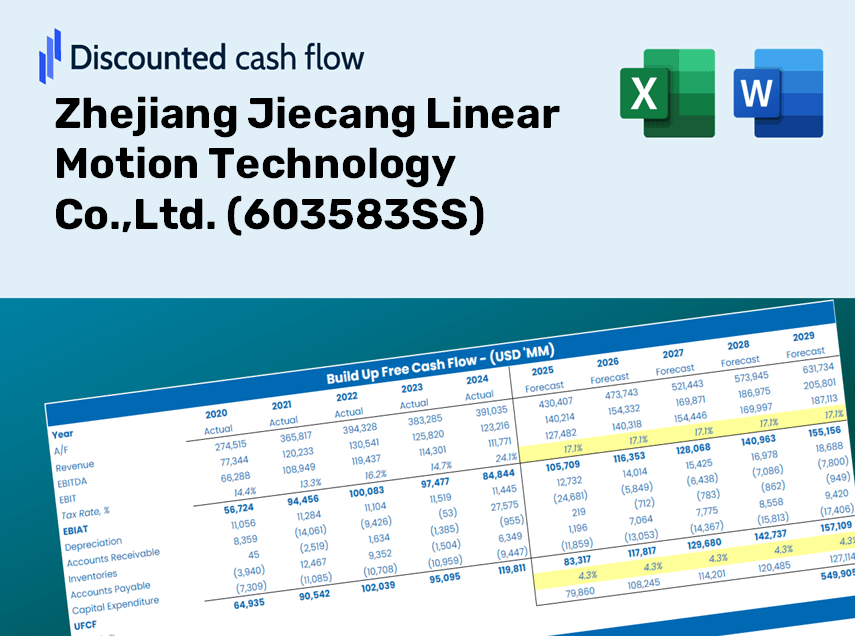
Discounted Cash Flow (DCF) - (USD MM)
| Year | AY1 2020 |
AY2 2021 |
AY3 2022 |
AY4 2023 |
AY5 2024 |
FY1 2025 |
FY2 2026 |
FY3 2027 |
FY4 2028 |
FY5 2029 |
|---|---|---|---|---|---|---|---|---|---|---|
| Revenue | 1,868.3 | 2,637.0 | 3,006.6 | 3,034.0 | 3,652.0 | 4,349.9 | 5,181.3 | 6,171.4 | 7,350.8 | 8,755.6 |
| Revenue Growth, % | 0 | 41.15 | 14.02 | 0.9113 | 20.37 | 19.11 | 19.11 | 19.11 | 19.11 | 19.11 |
| EBITDA | 485.5 | 318.1 | 394.4 | 466.0 | 605.9 | 723.1 | 861.3 | 1,025.9 | 1,221.9 | 1,455.5 |
| EBITDA, % | 25.99 | 12.06 | 13.12 | 15.36 | 16.59 | 16.62 | 16.62 | 16.62 | 16.62 | 16.62 |
| Depreciation | 51.5 | 123.8 | 182.7 | 203.1 | 204.9 | 224.8 | 267.7 | 318.9 | 379.8 | 452.4 |
| Depreciation, % | 2.76 | 4.69 | 6.08 | 6.69 | 5.61 | 5.17 | 5.17 | 5.17 | 5.17 | 5.17 |
| EBIT | 433.9 | 194.3 | 211.7 | 262.9 | 401.0 | 498.3 | 593.6 | 707.0 | 842.1 | 1,003.1 |
| EBIT, % | 23.23 | 7.37 | 7.04 | 8.67 | 10.98 | 11.46 | 11.46 | 11.46 | 11.46 | 11.46 |
| Total Cash | 2,761.7 | 2,271.0 | 2,485.9 | 2,166.6 | 2,184.2 | 3,480.1 | 4,145.2 | 4,937.4 | 5,881.0 | 7,004.9 |
| Total Cash, percent | .0 | .0 | .0 | .0 | .0 | .0 | .0 | .0 | .0 | .0 |
| Account Receivables | 191.5 | 525.2 | 448.6 | 529.1 | 740.7 | 720.4 | 858.1 | 1,022.1 | 1,217.4 | 1,450.0 |
| Account Receivables, % | 10.25 | 19.92 | 14.92 | 17.44 | 20.28 | 16.56 | 16.56 | 16.56 | 16.56 | 16.56 |
| Inventories | 385.8 | 826.3 | 802.7 | 740.3 | 892.3 | 1,109.4 | 1,321.4 | 1,573.9 | 1,874.7 | 2,233.0 |
| Inventories, % | 20.65 | 31.33 | 26.7 | 24.4 | 24.43 | 25.5 | 25.5 | 25.5 | 25.5 | 25.5 |
| Accounts Payable | 351.0 | 931.0 | 577.8 | 246.2 | 904.6 | 923.9 | 1,100.5 | 1,310.8 | 1,561.3 | 1,859.6 |
| Accounts Payable, % | 18.79 | 35.3 | 19.22 | 8.11 | 24.77 | 21.24 | 21.24 | 21.24 | 21.24 | 21.24 |
| Capital Expenditure | -320.8 | -608.3 | -412.2 | -269.8 | -548.8 | -677.5 | -806.9 | -961.1 | -1,144.8 | -1,363.6 |
| Capital Expenditure, % | -17.17 | -23.07 | -13.71 | -8.89 | -15.03 | -15.57 | -15.57 | -15.57 | -15.57 | -15.57 |
| Tax Rate, % | 15.22 | 15.22 | 15.22 | 15.22 | 15.22 | 15.22 | 15.22 | 15.22 | 15.22 | 15.22 |
| EBITAT | 373.0 | 186.8 | 190.1 | 246.9 | 339.9 | 449.1 | 534.9 | 637.2 | 758.9 | 904.0 |
| Depreciation | ||||||||||
| Changes in Account Receivables | ||||||||||
| Changes in Inventories | ||||||||||
| Changes in Accounts Payable | ||||||||||
| Capital Expenditure | ||||||||||
| UFCF | -122.4 | -492.1 | -292.3 | -169.6 | 290.9 | -181.1 | -177.4 | -211.3 | -251.7 | -299.8 |
| WACC, % | 9.6 | 9.62 | 9.61 | 9.62 | 9.6 | 9.61 | 9.61 | 9.61 | 9.61 | 9.61 |
| PV UFCF | ||||||||||
| SUM PV UFCF | -837.2 | |||||||||
| Long Term Growth Rate, % | 3.50 | |||||||||
| Free cash flow (T + 1) | -310 | |||||||||
| Terminal Value | -5,080 | |||||||||
| Present Terminal Value | -3,211 | |||||||||
| Enterprise Value | -4,049 | |||||||||
| Net Debt | -1,296 | |||||||||
| Equity Value | -2,752 | |||||||||
| Diluted Shares Outstanding, MM | 381 | |||||||||
| Equity Value Per Share | -7.22 |
Benefits You Will Receive
- Authentic Jiecang Financial Data: Access to both historical and projected figures for precise valuation.
- Customizable Parameters: Adjust inputs for WACC, tax rates, revenue expansion, and capital investments.
- Real-Time Calculations: Automatic determination of intrinsic value and NPV as changes are made.
- Comprehensive Scenario Analysis: Explore various scenarios to assess the future outlook of Zhejiang Jiecang Linear Motion Technology Co.,Ltd. (603583SS).
- User-Friendly Design: Designed for industry professionals while remaining approachable for newcomers.
Key Features
- Comprehensive Historical Data: Access Zhejiang Jiecang's financial statements and pre-loaded growth forecasts.
- Customizable Parameters: Adjust key inputs such as WACC, tax rates, revenue growth, and EBITDA margins as needed.
- Real-Time Valuation: Instantly view the recalculated intrinsic value of Zhejiang Jiecang (603583SS).
- Insightful Visualizations: Experience clear dashboard charts that present valuation outcomes and essential metrics.
- Designed for Precision: A robust tool tailored for analysts, investors, and finance professionals.
How It Works
- Step 1: Download the Excel file.
- Step 2: Examine Zhejiang Jiecang's pre-filled financial data and forecasts.
- Step 3: Adjust key inputs such as revenue growth, WACC, and tax rates (highlighted cells).
- Step 4: Observe the DCF model update in real-time as you modify assumptions.
- Step 5: Evaluate the outputs and leverage the results for investment choices.
Why Opt for This Calculator?
- Designed for Experts: A sophisticated tool crafted for analysts, CFOs, and consultants.
- Accurate Data: Historical and projected financials of Zhejiang Jiecang Linear Motion Technology Co., Ltd. loaded for precision.
- Forecast Simulation: Effortlessly test various scenarios and assumptions.
- Comprehensive Outputs: Instantly calculates intrinsic value, NPV, and essential metrics.
- User-Friendly Interface: Easy-to-follow instructions walk you through each step.
Who Should Benefit from This Product?
- Investors: Make informed decisions by accurately assessing the fair value of Zhejiang Jiecang Linear Motion Technology Co., Ltd. (603583SS).
- Financial Officers: Utilize a top-tier DCF model for comprehensive financial analysis and reporting.
- Consultants: Seamlessly customize the template for valuation reports tailored to client needs.
- Entrepreneurs: Discover financial modeling techniques employed by leading industry players.
- Educators: Employ it as an educational resource to illustrate valuation practices.
Contents of the Template
- Preloaded Jiecang Data: Historical and projected financial metrics, including revenue, EBIT, and capital expenditures.
- DCF and WACC Models: Advanced spreadsheets for determining intrinsic value and Weighted Average Cost of Capital.
- Editable Inputs: Cells highlighted in yellow for customizing revenue growth, tax rates, and discount rates.
- Financial Statements: Detailed annual and quarterly financial data for thorough analysis.
- Key Ratios: Metrics for profitability, leverage, and efficiency to assess performance.
- Dashboard and Charts: Visual representations of valuation results and underlying assumptions.
Disclaimer
All information, articles, and product details provided on this website are for general informational and educational purposes only. We do not claim any ownership over, nor do we intend to infringe upon, any trademarks, copyrights, logos, brand names, or other intellectual property mentioned or depicted on this site. Such intellectual property remains the property of its respective owners, and any references here are made solely for identification or informational purposes, without implying any affiliation, endorsement, or partnership.
We make no representations or warranties, express or implied, regarding the accuracy, completeness, or suitability of any content or products presented. Nothing on this website should be construed as legal, tax, investment, financial, medical, or other professional advice. In addition, no part of this site—including articles or product references—constitutes a solicitation, recommendation, endorsement, advertisement, or offer to buy or sell any securities, franchises, or other financial instruments, particularly in jurisdictions where such activity would be unlawful.
All content is of a general nature and may not address the specific circumstances of any individual or entity. It is not a substitute for professional advice or services. Any actions you take based on the information provided here are strictly at your own risk. You accept full responsibility for any decisions or outcomes arising from your use of this website and agree to release us from any liability in connection with your use of, or reliance upon, the content or products found herein.