
|
Pequim United Information Technology Co., Ltd. (603613.Ss) Avaliação do DCF |
Totalmente Editável: Adapte-Se Às Suas Necessidades No Excel Ou Planilhas
Design Profissional: Modelos Confiáveis E Padrão Da Indústria
Pré-Construídos Para Uso Rápido E Eficiente
Compatível com MAC/PC, totalmente desbloqueado
Não É Necessária Experiência; Fácil De Seguir
Beijing United Information Technology Co.,Ltd. (603613.SS) Bundle
Descubra o verdadeiro potencial da Pequim United Information Technology Co., Ltd. com nossa calculadora DCF de nível profissional! Ajuste as principais suposições, explore vários cenários e avalie como as mudanças afetam a Beijing United Information Technology Co., Ltd. Avaliação - tudo dentro de um único modelo do Excel.
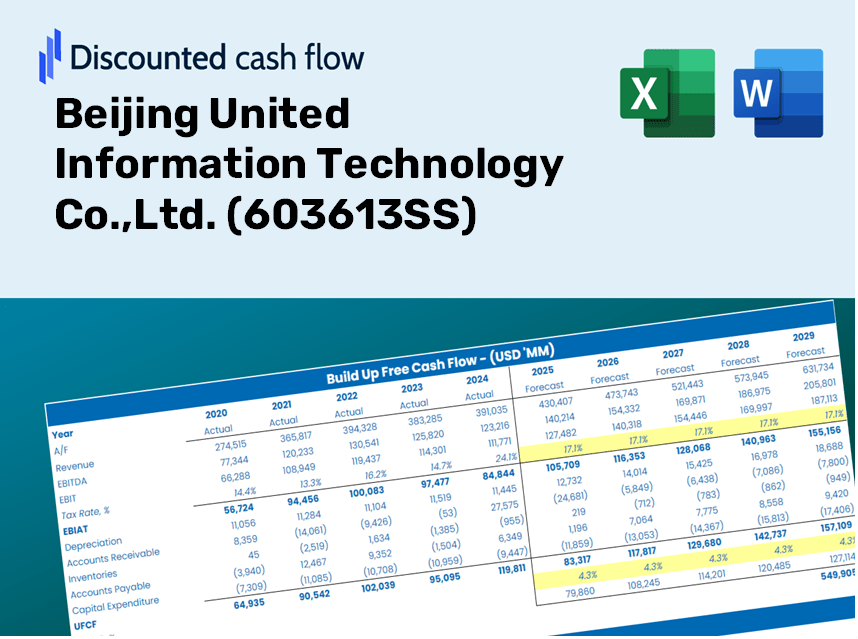
Discounted Cash Flow (DCF) - (USD MM)
| Year | AY1 2020 |
AY2 2021 |
AY3 2022 |
AY4 2023 |
AY5 2024 |
FY1 2025 |
FY2 2026 |
FY3 2027 |
FY4 2028 |
FY5 2029 |
|---|---|---|---|---|---|---|---|---|---|---|
| Revenue | 17,157.8 | 37,229.8 | 40,269.0 | 50,684.6 | 53,584.8 | 50,976.3 | 48,494.8 | 46,134.1 | 43,888.3 | 41,751.9 |
| Revenue Growth, % | 0 | 116.98 | 8.16 | 25.87 | 5.72 | -4.87 | -4.87 | -4.87 | -4.87 | -4.87 |
| EBITDA | 430.5 | 885.0 | 1,702.9 | 2,226.1 | 2,172.1 | 1,790.3 | 1,703.2 | 1,620.3 | 1,541.4 | 1,466.4 |
| EBITDA, % | 2.51 | 2.38 | 4.23 | 4.39 | 4.05 | 3.51 | 3.51 | 3.51 | 3.51 | 3.51 |
| Depreciation | 5.5 | 12.4 | 25.4 | 53.1 | 19.8 | 27.5 | 26.2 | 24.9 | 23.7 | 22.6 |
| Depreciation, % | 0.03206649 | 0.03331019 | 0.06298305 | 0.10483 | 0.03694692 | 0.05402756 | 0.05402756 | 0.05402756 | 0.05402756 | 0.05402756 |
| EBIT | 425.0 | 872.6 | 1,677.6 | 2,173.0 | 2,152.3 | 1,762.8 | 1,677.0 | 1,595.4 | 1,517.7 | 1,443.8 |
| EBIT, % | 2.48 | 2.34 | 4.17 | 4.29 | 4.02 | 3.46 | 3.46 | 3.46 | 3.46 | 3.46 |
| Total Cash | 4,496.3 | 5,088.9 | 5,856.3 | 7,075.6 | 6,306.9 | 8,171.3 | 7,773.5 | 7,395.1 | 7,035.1 | 6,692.6 |
| Total Cash, percent | .0 | .0 | .0 | .0 | .0 | .0 | .0 | .0 | .0 | .0 |
| Account Receivables | 819.3 | 1,570.1 | 2,558.3 | 2,182.2 | 1,948.7 | 2,374.2 | 2,258.6 | 2,148.7 | 2,044.1 | 1,944.6 |
| Account Receivables, % | 4.78 | 4.22 | 6.35 | 4.31 | 3.64 | 4.66 | 4.66 | 4.66 | 4.66 | 4.66 |
| Inventories | 30.1 | 70.2 | 48.8 | 393.6 | 633.1 | 249.1 | 237.0 | 225.5 | 214.5 | 204.0 |
| Inventories, % | 0.17564 | 0.18847 | 0.12131 | 0.77662 | 1.18 | 0.4887 | 0.4887 | 0.4887 | 0.4887 | 0.4887 |
| Accounts Payable | 1,641.3 | 2,404.8 | 3,329.5 | 3,084.2 | 3,439.2 | 3,751.5 | 3,568.9 | 3,395.2 | 3,229.9 | 3,072.7 |
| Accounts Payable, % | 9.57 | 6.46 | 8.27 | 6.09 | 6.42 | 7.36 | 7.36 | 7.36 | 7.36 | 7.36 |
| Capital Expenditure | -114.2 | -78.1 | -173.8 | -142.3 | -129.8 | -186.6 | -177.5 | -168.9 | -160.7 | -152.8 |
| Capital Expenditure, % | -0.66569 | -0.20984 | -0.43156 | -0.28084 | -0.24231 | -0.36605 | -0.36605 | -0.36605 | -0.36605 | -0.36605 |
| Tax Rate, % | 34.36 | 34.36 | 34.36 | 34.36 | 34.36 | 34.36 | 34.36 | 34.36 | 34.36 | 34.36 |
| EBITAT | 275.2 | 541.2 | 1,062.0 | 1,384.0 | 1,412.8 | 1,126.2 | 1,071.4 | 1,019.2 | 969.6 | 922.4 |
| Depreciation | ||||||||||
| Changes in Account Receivables | ||||||||||
| Changes in Inventories | ||||||||||
| Changes in Accounts Payable | ||||||||||
| Capital Expenditure | ||||||||||
| UFCF | 958.4 | 448.1 | 871.5 | 1,080.7 | 1,651.8 | 1,237.9 | 865.1 | 823.0 | 782.9 | 744.8 |
| WACC, % | 4.57 | 4.56 | 4.57 | 4.57 | 4.58 | 4.57 | 4.57 | 4.57 | 4.57 | 4.57 |
| PV UFCF | ||||||||||
| SUM PV UFCF | 3,945.3 | |||||||||
| Long Term Growth Rate, % | 0.50 | |||||||||
| Free cash flow (T + 1) | 749 | |||||||||
| Terminal Value | 18,398 | |||||||||
| Present Terminal Value | 14,715 | |||||||||
| Enterprise Value | 18,660 | |||||||||
| Net Debt | -4,389 | |||||||||
| Equity Value | 23,049 | |||||||||
| Diluted Shares Outstanding, MM | 720 | |||||||||
| Equity Value Per Share | 32.00 |
What You Will Receive
- Genuine Beijing United Data: Pre-loaded financial statistics – from revenue to EBIT – based on actual and projected numbers.
- Comprehensive Customization: Modify all essential parameters (yellow cells) such as WACC, growth %, and tax rates.
- Immediate Valuation Updates: Automatic recalculations to assess the effects of changes on Beijing United's fair value.
- Flexible Excel Template: Designed for quick adjustments, scenario analysis, and detailed forecasting.
- Efficient and Precise: Eliminate the need to build models from the ground up while ensuring accuracy and adaptability.
Key Features
- Authentic Financial Data: Access reliable pre-loaded historical figures and future forecasts for Beijing United Information Technology Co., Ltd. (603613SS).
- Adjustable Forecast Assumptions: Modify highlighted cells such as WACC, growth rates, and profit margins to fit your analysis.
- Real-Time Calculations: Automatic updates to DCF, Net Present Value (NPV), and cash flow evaluations.
- Interactive Dashboard: User-friendly charts and summaries to help you visualize valuation outcomes.
- Suitable for All Skill Levels: An intuitive design tailored for investors, CFOs, and consultants alike.
How It Works
- Step 1: Download the Excel file.
- Step 2: Review the pre-filled data for Beijing United Information Technology Co., Ltd. (603613SS) including historical and projected figures.
- Step 3: Modify the key assumptions (indicated in yellow cells) based on your insights.
- Step 4: Observe the automatic recalculations of Beijing United Information Technology Co., Ltd.'s (603613SS) intrinsic value.
- Step 5: Utilize the results for making informed investment decisions or for reporting purposes.
Why Opt for Beijing United Information Technology Co., Ltd. (603613SS)?
- Efficient Time Management: Skip the hassle of building a financial model from the ground up – our tools are instantly accessible.
- Enhanced Precision: Access to dependable financial data and robust formulas minimizes valuation inaccuracies.
- Completely Customizable: Adjust the model to represent your specific assumptions and forecasts.
- User-Friendly Output: Intuitive graphs and results simplify data analysis for better understanding.
- Endorsed by Industry Professionals: Crafted for experts who prioritize accuracy and functionality.
Who Would Benefit from This Product?
- Individual Investors: Make well-informed choices regarding the purchase or sale of Beijing United Information Technology Co.,Ltd. (603613SS) shares.
- Financial Analysts: Enhance valuation workflows with ready-to-implement financial models tailored for Beijing United Information Technology Co.,Ltd. (603613SS).
- Consultants: Provide clients with accurate and timely valuation insights for Beijing United Information Technology Co.,Ltd. (603613SS).
- Business Owners: Gain insights into the valuation of major companies like Beijing United Information Technology Co.,Ltd. (603613SS) to inform your own business strategies.
- Finance Students: Master valuation methods using real-world data and case studies related to Beijing United Information Technology Co.,Ltd. (603613SS).
Contents of the Template
- Historical Data: Comprehensive records of Beijing United Information Technology Co., Ltd.'s past financial performance and baseline forecasts.
- DCF and Levered DCF Models: In-depth templates designed to estimate the intrinsic value of Beijing United Information Technology Co., Ltd. (603613SS).
- WACC Sheet: Pre-constructed calculations for the Weighted Average Cost of Capital.
- Editable Inputs: Customize essential parameters such as growth rates, EBITDA percentages, and CAPEX assumptions.
- Quarterly and Annual Statements: A thorough analysis of Beijing United Information Technology Co., Ltd.'s financial statements.
- Interactive Dashboard: Dynamic visualization of valuation results and future projections.
Disclaimer
All information, articles, and product details provided on this website are for general informational and educational purposes only. We do not claim any ownership over, nor do we intend to infringe upon, any trademarks, copyrights, logos, brand names, or other intellectual property mentioned or depicted on this site. Such intellectual property remains the property of its respective owners, and any references here are made solely for identification or informational purposes, without implying any affiliation, endorsement, or partnership.
We make no representations or warranties, express or implied, regarding the accuracy, completeness, or suitability of any content or products presented. Nothing on this website should be construed as legal, tax, investment, financial, medical, or other professional advice. In addition, no part of this site—including articles or product references—constitutes a solicitation, recommendation, endorsement, advertisement, or offer to buy or sell any securities, franchises, or other financial instruments, particularly in jurisdictions where such activity would be unlawful.
All content is of a general nature and may not address the specific circumstances of any individual or entity. It is not a substitute for professional advice or services. Any actions you take based on the information provided here are strictly at your own risk. You accept full responsibility for any decisions or outcomes arising from your use of this website and agree to release us from any liability in connection with your use of, or reliance upon, the content or products found herein.