
|
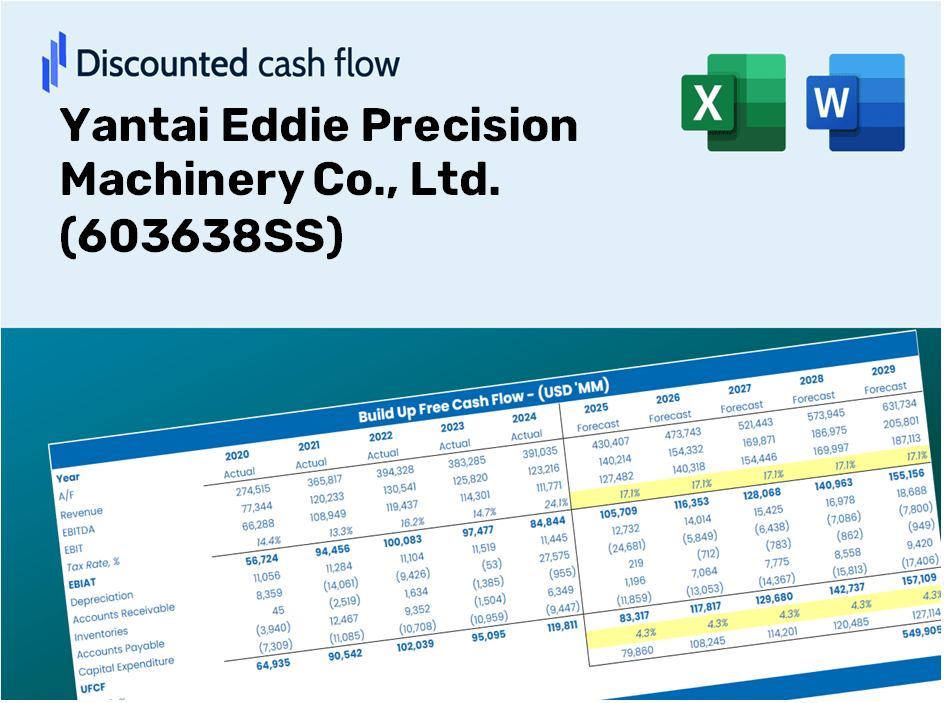
Yantai Eddie Precision Machinery Co., Ltd. (603638.SS) DCF Avaliação |
Totalmente Editável: Adapte-Se Às Suas Necessidades No Excel Ou Planilhas
Design Profissional: Modelos Confiáveis E Padrão Da Indústria
Pré-Construídos Para Uso Rápido E Eficiente
Compatível com MAC/PC, totalmente desbloqueado
Não É Necessária Experiência; Fácil De Seguir
Yantai Eddie Precision Machinery Co., Ltd. (603638.SS) Bundle
Otimize sua eficiência e melhore a precisão com nossa calculadora DCF (603638SS)! Utilizando dados reais da Yantai Eddie Precision Machinery Co., Ltd. e suposições personalizáveis, essa ferramenta o capacita a prever, analisar e valorizar Yantai Eddie como um investidor experiente.
Discounted Cash Flow (DCF) - (USD MM)
| Year | AY1 2020 |
AY2 2021 |
AY3 2022 |
AY4 2023 |
AY5 2024 |
FY1 2025 |
FY2 2026 |
FY3 2027 |
FY4 2028 |
FY5 2029 |
|---|---|---|---|---|---|---|---|---|---|---|
| Revenue | 2,255.6 | 2,684.0 | 2,025.0 | 2,235.4 | 2,724.9 | 2,906.9 | 3,101.1 | 3,308.3 | 3,529.3 | 3,765.1 |
| Revenue Growth, % | 0 | 18.99 | -24.55 | 10.39 | 21.9 | 6.68 | 6.68 | 6.68 | 6.68 | 6.68 |
| EBITDA | 705.2 | 680.9 | 458.6 | 569.4 | 652.6 | 748.2 | 798.2 | 851.6 | 908.5 | 969.1 |
| EBITDA, % | 31.26 | 25.37 | 22.64 | 25.47 | 23.95 | 25.74 | 25.74 | 25.74 | 25.74 | 25.74 |
| Depreciation | 106.2 | 146.8 | 174.6 | 222.2 | 247.1 | 219.8 | 234.5 | 250.1 | 266.8 | 284.7 |
| Depreciation, % | 4.71 | 5.47 | 8.62 | 9.94 | 9.07 | 7.56 | 7.56 | 7.56 | 7.56 | 7.56 |
| EBIT | 599.0 | 534.2 | 284.0 | 347.2 | 405.5 | 528.5 | 563.8 | 601.4 | 641.6 | 684.5 |
| EBIT, % | 26.56 | 19.9 | 14.02 | 15.53 | 14.88 | 18.18 | 18.18 | 18.18 | 18.18 | 18.18 |
| Total Cash | 606.0 | 258.8 | 1,083.2 | 924.0 | 1,061.3 | 990.0 | 1,056.1 | 1,126.7 | 1,202.0 | 1,282.3 |
| Total Cash, percent | .0 | .0 | .0 | .0 | .0 | .0 | .0 | .0 | .0 | .0 |
| Account Receivables | 802.0 | 858.6 | 829.7 | 1,161.3 | 1,441.7 | 1,240.6 | 1,323.4 | 1,411.9 | 1,506.2 | 1,606.8 |
| Account Receivables, % | 35.56 | 31.99 | 40.97 | 51.95 | 52.91 | 42.68 | 42.68 | 42.68 | 42.68 | 42.68 |
| Inventories | 622.0 | 829.1 | 865.1 | 945.8 | 1,181.5 | 1,086.4 | 1,158.9 | 1,236.4 | 1,319.0 | 1,407.1 |
| Inventories, % | 27.58 | 30.89 | 42.72 | 42.31 | 43.36 | 37.37 | 37.37 | 37.37 | 37.37 | 37.37 |
| Accounts Payable | 661.5 | 914.9 | 457.4 | 731.1 | 1,072.8 | 919.1 | 980.5 | 1,046.0 | 1,115.8 | 1,190.4 |
| Accounts Payable, % | 29.33 | 34.09 | 22.59 | 32.71 | 39.37 | 31.62 | 31.62 | 31.62 | 31.62 | 31.62 |
| Capital Expenditure | -669.0 | -535.3 | -139.8 | -126.4 | -154.9 | -394.4 | -420.8 | -448.9 | -478.9 | -510.9 |
| Capital Expenditure, % | -29.66 | -19.94 | -6.9 | -5.65 | -5.69 | -13.57 | -13.57 | -13.57 | -13.57 | -13.57 |
| Tax Rate, % | 14.64 | 14.64 | 14.64 | 14.64 | 14.64 | 14.64 | 14.64 | 14.64 | 14.64 | 14.64 |
| EBITAT | 518.1 | 462.9 | 243.7 | 293.2 | 346.2 | 453.2 | 483.5 | 515.8 | 550.2 | 587.0 |
| Depreciation | ||||||||||
| Changes in Account Receivables | ||||||||||
| Changes in Inventories | ||||||||||
| Changes in Accounts Payable | ||||||||||
| Capital Expenditure | ||||||||||
| UFCF | -807.3 | 64.0 | -186.0 | 250.4 | 263.9 | 421.1 | 203.1 | 216.7 | 231.1 | 246.6 |
| WACC, % | 9.65 | 9.65 | 9.65 | 9.64 | 9.65 | 9.65 | 9.65 | 9.65 | 9.65 | 9.65 |
| PV UFCF | ||||||||||
| SUM PV UFCF | 1,032.8 | |||||||||
| Long Term Growth Rate, % | 4.00 | |||||||||
| Free cash flow (T + 1) | 256 | |||||||||
| Terminal Value | 4,539 | |||||||||
| Present Terminal Value | 2,864 | |||||||||
| Enterprise Value | 3,897 | |||||||||
| Net Debt | 753 | |||||||||
| Equity Value | 3,143 | |||||||||
| Diluted Shares Outstanding, MM | 839 | |||||||||
| Equity Value Per Share | 3.74 |
What You Will Receive
- Authentic Yantai Eddie Financials: Access to both historical and projected data for precise valuation.
- Customizable Inputs: Adjust parameters such as WACC, tax rates, revenue growth, and capital investments.
- Real-Time Calculations: Dynamic calculations for intrinsic value and NPV.
- Scenario Assessment: Evaluate various scenarios to analyze Yantai Eddie’s future performance.
- User-Friendly Design: Designed for professionals while remaining easy to navigate for beginners.
Key Features
- Customizable Forecast Inputs: Adjust key parameters such as revenue growth, EBITDA margin, and capital expenditures effortlessly.
- Instant DCF Valuation: Quickly computes intrinsic value, net present value (NPV), and additional outputs with ease.
- High-Precision Insights: Relies on Yantai Eddie Precision Machinery's (603638SS) real financial data for accurate valuation results.
- Streamlined Scenario Analysis: Easily evaluate various assumptions and visualize different outcomes.
- Efficiency Booster: Remove the complexity of constructing intricate valuation models from the ground up.
How It Works
- 1. Access the Template: Download and open the Excel file featuring Yantai Eddie Precision Machinery Co., Ltd.'s (603638SS) preloaded data.
- 2. Modify Assumptions: Adjust key inputs such as growth rates, WACC, and capital expenditures to fit your analysis.
- 3. Observe Results in Real-Time: The DCF model automatically calculates intrinsic value and NPV based on your inputs.
- 4. Explore Different Scenarios: Analyze various forecasts to evaluate different valuation possibilities.
- 5. Present with Assurance: Deliver professional valuation insights to back up your decision-making process.
Why Opt for Yantai Eddie Precision Machinery Co., Ltd. (603638SS)?
- Dependable Performance: Utilize real-world data to guarantee reliable outcomes.
- Customizable Options: Tailored for users to easily adjust and experiment with settings.
- Efficiency: Eliminate the complexities of starting machinery assessments from the ground up.
- Industry Excellence: Crafted with the precision and functionality expected by industry leaders.
- Accessible: Intuitive design makes it simple for anyone, regardless of their technical background.
Who Can Benefit from This Product?
- Individual Investors: Gain insights to make well-informed choices regarding investments in Yantai Eddie Precision Machinery Co., Ltd. (603638SS).
- Financial Analysts: Enhance evaluation processes with efficient, ready-made financial models specific to this company.
- Consultants: Provide clients with accurate and prompt valuation assessments related to Yantai Eddie Precision Machinery Co., Ltd. (603638SS).
- Business Owners: Learn from the valuation methods applied to large firms like Yantai Eddie Precision Machinery Co., Ltd. (603638SS) to refine your own business strategies.
- Finance Students: Acquire practical valuation skills by analyzing real-life data and scenarios involving Yantai Eddie Precision Machinery Co., Ltd. (603638SS).
What the Template Contains for Yantai Eddie Precision Machinery Co., Ltd. (603638SS)
- Historical Data: Contains Yantai Eddie’s previous financial results and foundational forecasts.
- DCF and Levered DCF Models: Comprehensive templates for determining Yantai Eddie’s intrinsic value.
- WACC Sheet: Ready-to-use calculations for Weighted Average Cost of Capital.
- Editable Inputs: Tailor key factors such as growth rates, EBITDA %, and CAPEX assumptions.
- Quarterly and Annual Statements: An in-depth overview of Yantai Eddie’s financial performance.
- Interactive Dashboard: Dynamically visualize valuation outcomes and future projections.
Disclaimer
All information, articles, and product details provided on this website are for general informational and educational purposes only. We do not claim any ownership over, nor do we intend to infringe upon, any trademarks, copyrights, logos, brand names, or other intellectual property mentioned or depicted on this site. Such intellectual property remains the property of its respective owners, and any references here are made solely for identification or informational purposes, without implying any affiliation, endorsement, or partnership.
We make no representations or warranties, express or implied, regarding the accuracy, completeness, or suitability of any content or products presented. Nothing on this website should be construed as legal, tax, investment, financial, medical, or other professional advice. In addition, no part of this site—including articles or product references—constitutes a solicitation, recommendation, endorsement, advertisement, or offer to buy or sell any securities, franchises, or other financial instruments, particularly in jurisdictions where such activity would be unlawful.
All content is of a general nature and may not address the specific circumstances of any individual or entity. It is not a substitute for professional advice or services. Any actions you take based on the information provided here are strictly at your own risk. You accept full responsibility for any decisions or outcomes arising from your use of this website and agree to release us from any liability in connection with your use of, or reliance upon, the content or products found herein.