
|
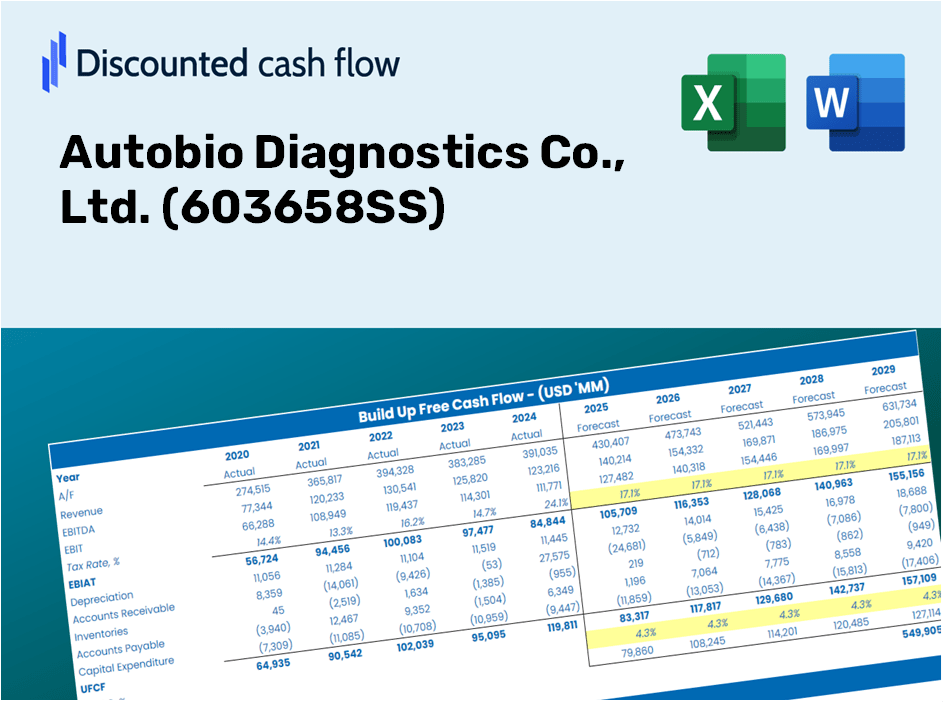
Autobio Diagnostics Co., Ltd. (603658.SS) Avaliação DCF |
Totalmente Editável: Adapte-Se Às Suas Necessidades No Excel Ou Planilhas
Design Profissional: Modelos Confiáveis E Padrão Da Indústria
Pré-Construídos Para Uso Rápido E Eficiente
Compatível com MAC/PC, totalmente desbloqueado
Não É Necessária Experiência; Fácil De Seguir
Autobio Diagnostics Co., Ltd. (603658.SS) Bundle
Procurando determinar o valor intrínseco da Autobio Diagnostics Co., Ltd.? Nossa calculadora (603658SS) integra dados do mundo real com extensos recursos de personalização, permitindo refinar suas previsões e aprimorar suas opções de investimento.
What You Will Receive
- Genuine Autobio Data: Preloaded financial metrics – from revenue to EBIT – sourced from actual and projected figures.
- Complete Customization: Tailor all key parameters (yellow cells) such as WACC, growth %, and tax rates.
- Real-Time Valuation Updates: Automatic recalculations to assess the impact of adjustments on Autobio's fair value.
- Flexible Excel Template: Designed for easy modifications, scenario analysis, and comprehensive forecasts.
- Efficient and Precise: Eliminate the need to build models from the ground up while ensuring accuracy and adaptability.
Key Features
- Authentic Financial Data: Access comprehensive pre-loaded historical records and future forecasts for Autobio Diagnostics Co., Ltd. (603658SS).
- Adjustable Forecast Parameters: Modify yellow-highlighted cells, including WACC, growth rates, and profit margins to suit your analysis.
- Automated Calculations: Instant updates to DCF, Net Present Value (NPV), and cash flow assessments.
- Visual Analytics Dashboard: User-friendly charts and summaries to help you interpret your valuation findings.
- Designed for All Users: An intuitive layout tailored for investors, CFOs, and consultants, regardless of expertise level.
How It Functions
- Download the Template: Gain immediate access to the Excel-based [Symbol] DCF Calculator.
- Input Your Assumptions: Modify the yellow-highlighted cells for growth rates, WACC, profit margins, and other parameters.
- Instant Calculations: The model automatically recalculates the intrinsic value of Autobio Diagnostics.
- Test Scenarios: Experiment with various assumptions to assess potential valuation adjustments.
- Analyze and Decide: Leverage the results to inform your investment or financial strategies.
Why Choose Autobio Diagnostics Co., Ltd. (603658SS) Calculator?
- All-in-One Solution: Combines DCF, WACC, and financial ratio analyses for comprehensive evaluations.
- Flexible Customization: Modify yellow-highlighted cells to explore diverse scenarios.
- In-Depth Analysis: Instantly computes intrinsic value and Net Present Value for Autobio Diagnostics.
- Data-Driven: Features historical and projected data to provide reliable baselines.
- High-Quality Standards: Perfect for financial analysts, investors, and business consultants in the diagnostics sector.
Who Can Benefit from This Product?
- Investors: Effectively assess the fair value of Autobio Diagnostics Co., Ltd. (603658SS) prior to making investment choices.
- CFOs: Utilize a professional-grade DCF model for accurate financial reporting and in-depth analysis.
- Consultants: Easily customize the template for client valuation reports.
- Entrepreneurs: Acquire knowledge on financial modeling techniques employed by leading healthcare companies.
- Educators: Employ this resource as a teaching aid to illustrate valuation methods.
What the Template Includes
- Pre-Filled DCF Model: Autobio Diagnostics' financial data preloaded for instant application.
- WACC Calculator: Comprehensive calculations for Weighted Average Cost of Capital.
- Financial Ratios: Assess Autobio's profitability, leverage, and operational efficiency.
- Editable Inputs: Modify assumptions like growth rates, profit margins, and capital expenditures to suit your analyses.
- Financial Statements: Access annual and quarterly reports for in-depth examination.
- Interactive Dashboard: Effortlessly visualize essential valuation metrics and outcomes.
Disclaimer
All information, articles, and product details provided on this website are for general informational and educational purposes only. We do not claim any ownership over, nor do we intend to infringe upon, any trademarks, copyrights, logos, brand names, or other intellectual property mentioned or depicted on this site. Such intellectual property remains the property of its respective owners, and any references here are made solely for identification or informational purposes, without implying any affiliation, endorsement, or partnership.
We make no representations or warranties, express or implied, regarding the accuracy, completeness, or suitability of any content or products presented. Nothing on this website should be construed as legal, tax, investment, financial, medical, or other professional advice. In addition, no part of this site—including articles or product references—constitutes a solicitation, recommendation, endorsement, advertisement, or offer to buy or sell any securities, franchises, or other financial instruments, particularly in jurisdictions where such activity would be unlawful.
All content is of a general nature and may not address the specific circumstances of any individual or entity. It is not a substitute for professional advice or services. Any actions you take based on the information provided here are strictly at your own risk. You accept full responsibility for any decisions or outcomes arising from your use of this website and agree to release us from any liability in connection with your use of, or reliance upon, the content or products found herein.