
|
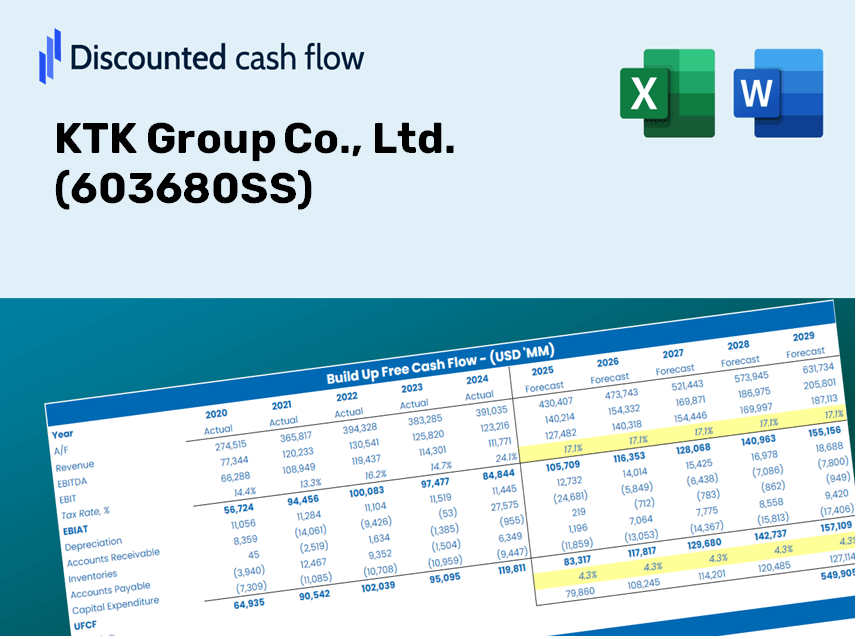
KTK Group Co., Ltd. (603680.SS) Avaliação DCF |
Totalmente Editável: Adapte-Se Às Suas Necessidades No Excel Ou Planilhas
Design Profissional: Modelos Confiáveis E Padrão Da Indústria
Pré-Construídos Para Uso Rápido E Eficiente
Compatível com MAC/PC, totalmente desbloqueado
Não É Necessária Experiência; Fácil De Seguir
KTK Group Co., Ltd. (603680.SS) Bundle
Procurando avaliar o valor intrínseco da KTK Group Co., Ltd.? Nossa calculadora DCF (603680SS) integra dados do mundo real com extensos recursos de personalização, permitindo refinar suas previsões e fazer escolhas de investimento mais informadas.
Discounted Cash Flow (DCF) - (USD MM)
| Year | AY1 2020 |
AY2 2021 |
AY3 2022 |
AY4 2023 |
AY5 2024 |
FY1 2025 |
FY2 2026 |
FY3 2027 |
FY4 2028 |
FY5 2029 |
|---|---|---|---|---|---|---|---|---|---|---|
| Revenue | 3,877.6 | 3,794.3 | 3,534.2 | 3,697.3 | 4,499.4 | 4,694.1 | 4,897.1 | 5,109.0 | 5,330.0 | 5,560.6 |
| Revenue Growth, % | 0 | -2.15 | -6.86 | 4.62 | 21.69 | 4.33 | 4.33 | 4.33 | 4.33 | 4.33 |
| EBITDA | 529.5 | 463.7 | 294.7 | 368.0 | 548.6 | 529.1 | 552.0 | 575.9 | 600.8 | 626.8 |
| EBITDA, % | 13.66 | 12.22 | 8.34 | 9.95 | 12.19 | 11.27 | 11.27 | 11.27 | 11.27 | 11.27 |
| Depreciation | 130.4 | 139.7 | 147.7 | 150.5 | 150.1 | 174.9 | 182.5 | 190.4 | 198.6 | 207.2 |
| Depreciation, % | 3.36 | 3.68 | 4.18 | 4.07 | 3.34 | 3.73 | 3.73 | 3.73 | 3.73 | 3.73 |
| EBIT | 399.1 | 324.0 | 147.0 | 217.5 | 398.5 | 354.2 | 369.5 | 385.5 | 402.2 | 419.6 |
| EBIT, % | 10.29 | 8.54 | 4.16 | 5.88 | 8.86 | 7.55 | 7.55 | 7.55 | 7.55 | 7.55 |
| Total Cash | 1,308.0 | 1,095.7 | 819.6 | 704.4 | 501.5 | 1,089.0 | 1,136.1 | 1,185.3 | 1,236.5 | 1,290.0 |
| Total Cash, percent | .0 | .0 | .0 | .0 | .0 | .0 | .0 | .0 | .0 | .0 |
| Account Receivables | 3,277.0 | 3,094.0 | 3,412.9 | 3,422.6 | 4,287.0 | 4,229.1 | 4,412.0 | 4,602.9 | 4,802.0 | 5,009.8 |
| Account Receivables, % | 84.51 | 81.54 | 96.57 | 92.57 | 95.28 | 90.09 | 90.09 | 90.09 | 90.09 | 90.09 |
| Inventories | 1,603.0 | 1,562.2 | 1,545.9 | 1,694.5 | 1,792.6 | 1,989.6 | 2,075.6 | 2,165.4 | 2,259.1 | 2,356.9 |
| Inventories, % | 41.34 | 41.17 | 43.74 | 45.83 | 39.84 | 42.38 | 42.38 | 42.38 | 42.38 | 42.38 |
| Accounts Payable | 1,591.8 | 1,289.6 | 1,313.7 | 1,489.0 | 1,710.1 | 1,788.3 | 1,865.7 | 1,946.4 | 2,030.6 | 2,118.5 |
| Accounts Payable, % | 41.05 | 33.99 | 37.17 | 40.27 | 38.01 | 38.1 | 38.1 | 38.1 | 38.1 | 38.1 |
| Capital Expenditure | -204.1 | -67.7 | -95.4 | -90.9 | -205.2 | -157.4 | -164.2 | -171.3 | -178.7 | -186.5 |
| Capital Expenditure, % | -5.26 | -1.79 | -2.7 | -2.46 | -4.56 | -3.35 | -3.35 | -3.35 | -3.35 | -3.35 |
| Tax Rate, % | 38.27 | 38.27 | 38.27 | 38.27 | 38.27 | 38.27 | 38.27 | 38.27 | 38.27 | 38.27 |
| EBITAT | 385.4 | 313.9 | 166.8 | 212.0 | 246.0 | 320.6 | 334.5 | 349.0 | 364.1 | 379.8 |
| Depreciation | ||||||||||
| Changes in Account Receivables | ||||||||||
| Changes in Inventories | ||||||||||
| Changes in Accounts Payable | ||||||||||
| Capital Expenditure | ||||||||||
| UFCF | -2,976.5 | 307.4 | -59.3 | 288.6 | -550.5 | 277.4 | 161.1 | 168.1 | 175.4 | 182.9 |
| WACC, % | 5.17 | 5.17 | 5.18 | 5.17 | 5.01 | 5.14 | 5.14 | 5.14 | 5.14 | 5.14 |
| PV UFCF | ||||||||||
| SUM PV UFCF | 840.1 | |||||||||
| Long Term Growth Rate, % | 3.00 | |||||||||
| Free cash flow (T + 1) | 188 | |||||||||
| Terminal Value | 8,807 | |||||||||
| Present Terminal Value | 6,855 | |||||||||
| Enterprise Value | 7,695 | |||||||||
| Net Debt | 551 | |||||||||
| Equity Value | 7,144 | |||||||||
| Diluted Shares Outstanding, MM | 775 | |||||||||
| Equity Value Per Share | 9.22 |
What You Will Receive
- Adjustable Forecast Parameters: Easily modify key assumptions (growth %, margins, WACC) to generate various scenarios.
- Real-Time Data: KTK Group Co., Ltd. (603680SS) financial information pre-loaded to accelerate your analysis.
- Automated DCF Calculations: The template computes Net Present Value (NPV) and intrinsic value for you automatically.
- Tailored and Professional Design: A refined Excel model that suits your valuation requirements.
- Designed for Analysts and Investors: Perfect for assessing projections, validating strategies, and enhancing efficiency.
Key Features
- Comprehensive DCF Calculator: Features detailed unlevered and levered DCF valuation models tailored for KTK Group Co., Ltd. (603680SS).
- WACC Calculator: Provides a pre-constructed Weighted Average Cost of Capital sheet with adjustable inputs specific to KTK Group Co., Ltd. (603680SS).
- Customizable Forecast Assumptions: Adjust growth rates, capital expenditures, and discount rates for accurate forecasting.
- Integrated Financial Ratios: Evaluate profitability, leverage, and efficiency ratios pertinent to KTK Group Co., Ltd. (603680SS).
- Interactive Dashboard and Charts: Visual representations that consolidate key valuation metrics for streamlined analysis.
How It Works
- Step 1: Download the prebuilt Excel template containing KTK Group Co., Ltd.'s (603680SS) data.
- Step 2: Review the pre-filled sheets to grasp the essential metrics.
- Step 3: Modify forecasts and assumptions in the editable yellow cells (WACC, growth, margins).
- Step 4: Instantly see the recalculated results, including KTK Group Co., Ltd.'s (603680SS) intrinsic value.
- Step 5: Utilize the outputs to make informed investment decisions or create reports.
Why Choose KTK Group Calculator?
- User-Friendly Interface: Tailored for both newcomers and seasoned professionals.
- Customizable Inputs: Adjust parameters seamlessly to suit your analysis needs.
- Real-Time Adjustments: Observe immediate updates to KTK Group's valuation as you modify inputs.
- Pre-Loaded Financial Data: Comes equipped with KTK Group's actual financial figures for swift analysis.
- Relied Upon by Experts: Utilized by investors and analysts for sound decision-making.
Who Can Benefit from KTK Group Co., Ltd. (603680SS)?
- Finance Students: Master valuation methodologies and practice with real-world data.
- Researchers: Utilize advanced financial models for academic study or publication.
- Investors: Evaluate your investment strategies and examine valuation results for KTK Group Co., Ltd. (603680SS).
- Financial Analysts: Enhance your analysis with a customizable DCF model designed for efficiency.
- Entrepreneurs: Discover how major corporations like KTK Group Co., Ltd. (603680SS) are assessed in the market.
What the Template Contains for KTK Group Co., Ltd. (603680SS)
- Historical Data: Comprehensive archive of KTK Group's previous financial performance and initial forecasts.
- DCF and Levered DCF Models: In-depth templates designed to assess KTK Group's intrinsic value.
- WACC Sheet: Pre-configured calculations for Weighted Average Cost of Capital.
- Editable Inputs: Adjust critical factors such as growth rates, EBITDA %, and CAPEX estimates.
- Quarterly and Annual Statements: Thorough analysis of KTK Group's financials.
- Interactive Dashboard: Dynamically visualize valuation results and future projections.
Disclaimer
All information, articles, and product details provided on this website are for general informational and educational purposes only. We do not claim any ownership over, nor do we intend to infringe upon, any trademarks, copyrights, logos, brand names, or other intellectual property mentioned or depicted on this site. Such intellectual property remains the property of its respective owners, and any references here are made solely for identification or informational purposes, without implying any affiliation, endorsement, or partnership.
We make no representations or warranties, express or implied, regarding the accuracy, completeness, or suitability of any content or products presented. Nothing on this website should be construed as legal, tax, investment, financial, medical, or other professional advice. In addition, no part of this site—including articles or product references—constitutes a solicitation, recommendation, endorsement, advertisement, or offer to buy or sell any securities, franchises, or other financial instruments, particularly in jurisdictions where such activity would be unlawful.
All content is of a general nature and may not address the specific circumstances of any individual or entity. It is not a substitute for professional advice or services. Any actions you take based on the information provided here are strictly at your own risk. You accept full responsibility for any decisions or outcomes arising from your use of this website and agree to release us from any liability in connection with your use of, or reliance upon, the content or products found herein.