
|
Fujian Kuncai Material Technology Co., Ltd. (603826.SS) Avaliação DCF |
Totalmente Editável: Adapte-Se Às Suas Necessidades No Excel Ou Planilhas
Design Profissional: Modelos Confiáveis E Padrão Da Indústria
Pré-Construídos Para Uso Rápido E Eficiente
Compatível com MAC/PC, totalmente desbloqueado
Não É Necessária Experiência; Fácil De Seguir
Fujian Kuncai Material Technology Co., Ltd. (603826.SS) Bundle
Explore o potencial financeiro da Fujian Kuncai Material Technology Co., Ltd. (603826Ss) com nossa calculadora DCF amigável! Digite suas suposições sobre crescimento, margens e custos para calcular o valor intrínseco da Fujian Kuncai Material Technology Co., Ltd. (603826Ss) e aprimore sua tomada de decisão de investimento.
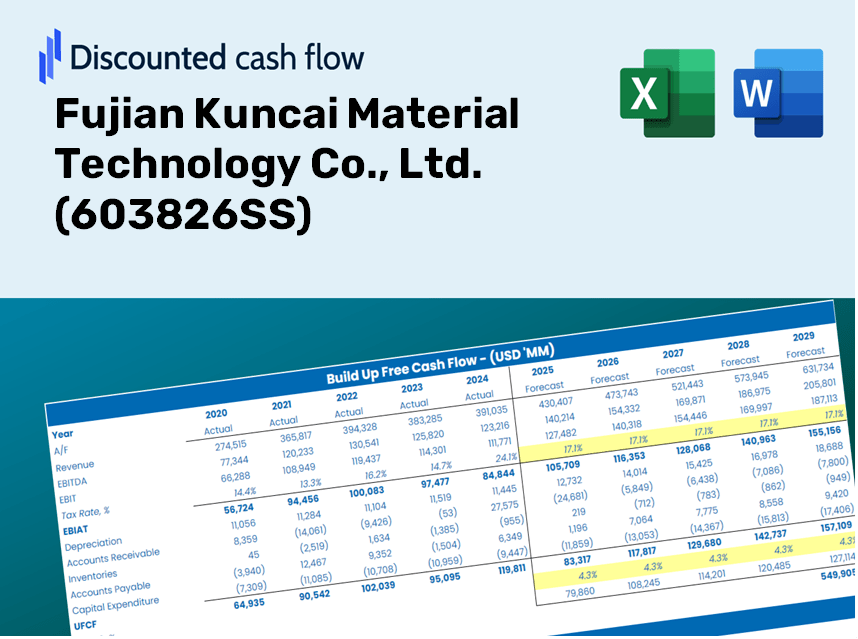
Discounted Cash Flow (DCF) - (USD MM)
| Year | AY1 2020 |
AY2 2021 |
AY3 2022 |
AY4 2023 |
AY5 2024 |
FY1 2025 |
FY2 2026 |
FY3 2027 |
FY4 2028 |
FY5 2029 |
|---|---|---|---|---|---|---|---|---|---|---|
| Revenue | 749.9 | 893.1 | 819.2 | 829.0 | 969.9 | 1,040.2 | 1,115.7 | 1,196.6 | 1,283.4 | 1,376.5 |
| Revenue Growth, % | 0 | 19.1 | -8.27 | 1.19 | 17 | 7.25 | 7.25 | 7.25 | 7.25 | 7.25 |
| EBITDA | 250.0 | 252.5 | 229.1 | 276.4 | 217.0 | 302.3 | 324.2 | 347.7 | 373.0 | 400.0 |
| EBITDA, % | 33.34 | 28.28 | 27.97 | 33.34 | 22.38 | 29.06 | 29.06 | 29.06 | 29.06 | 29.06 |
| Depreciation | 65.3 | 69.4 | 121.9 | 135.8 | 145.7 | 130.6 | 140.0 | 150.2 | 161.1 | 172.8 |
| Depreciation, % | 8.71 | 7.77 | 14.88 | 16.38 | 15.02 | 12.55 | 12.55 | 12.55 | 12.55 | 12.55 |
| EBIT | 184.7 | 183.2 | 107.2 | 140.6 | 71.3 | 171.7 | 184.2 | 197.5 | 211.9 | 227.2 |
| EBIT, % | 24.63 | 20.51 | 13.09 | 16.96 | 7.36 | 16.51 | 16.51 | 16.51 | 16.51 | 16.51 |
| Total Cash | 57.9 | 131.1 | 75.2 | 46.8 | 33.1 | 84.5 | 90.7 | 97.2 | 104.3 | 111.9 |
| Total Cash, percent | .0 | .0 | .0 | .0 | .0 | .0 | .0 | .0 | .0 | .0 |
| Account Receivables | 166.4 | 166.9 | 184.0 | 219.0 | 214.7 | 232.8 | 249.7 | 267.8 | 287.2 | 308.0 |
| Account Receivables, % | 22.18 | 18.68 | 22.46 | 26.42 | 22.13 | 22.38 | 22.38 | 22.38 | 22.38 | 22.38 |
| Inventories | 421.6 | 537.1 | 786.8 | 1,031.7 | 1,356.7 | 858.0 | 920.2 | 987.0 | 1,058.6 | 1,135.3 |
| Inventories, % | 56.22 | 60.14 | 96.04 | 124.45 | 139.88 | 82.48 | 82.48 | 82.48 | 82.48 | 82.48 |
| Accounts Payable | 168.7 | 251.4 | 313.2 | 485.4 | 522.1 | 418.7 | 449.1 | 481.7 | 516.6 | 554.1 |
| Accounts Payable, % | 22.5 | 28.14 | 38.23 | 58.56 | 53.83 | 40.25 | 40.25 | 40.25 | 40.25 | 40.25 |
| Capital Expenditure | -401.4 | -496.0 | -552.7 | -492.7 | -238.8 | -542.1 | -581.4 | -623.6 | -668.9 | -717.4 |
| Capital Expenditure, % | -53.52 | -55.53 | -67.46 | -59.44 | -24.62 | -52.11 | -52.11 | -52.11 | -52.11 | -52.11 |
| Tax Rate, % | -917.96 | -917.96 | -917.96 | -917.96 | -917.96 | -917.96 | -917.96 | -917.96 | -917.96 | -917.96 |
| EBITAT | 161.5 | 155.1 | 100.3 | 117.6 | 726.2 | 154.3 | 165.5 | 177.5 | 190.4 | 204.2 |
| Depreciation | ||||||||||
| Changes in Account Receivables | ||||||||||
| Changes in Inventories | ||||||||||
| Changes in Accounts Payable | ||||||||||
| Capital Expenditure | ||||||||||
| UFCF | -593.7 | -305.0 | -535.4 | -347.2 | 349.3 | 119.9 | -324.7 | -348.2 | -373.5 | -400.6 |
| WACC, % | 4.59 | 4.57 | 4.62 | 4.57 | 4.65 | 4.6 | 4.6 | 4.6 | 4.6 | 4.6 |
| PV UFCF | ||||||||||
| SUM PV UFCF | -1,118.3 | |||||||||
| Long Term Growth Rate, % | 2.00 | |||||||||
| Free cash flow (T + 1) | -409 | |||||||||
| Terminal Value | -15,718 | |||||||||
| Present Terminal Value | -12,553 | |||||||||
| Enterprise Value | -13,671 | |||||||||
| Net Debt | 1,441 | |||||||||
| Equity Value | -15,113 | |||||||||
| Diluted Shares Outstanding, MM | 656 | |||||||||
| Equity Value Per Share | -23.05 |
Your Benefits
- Adjustable Forecast Inputs: Easily modify key assumptions (growth %, profit margins, WACC) to explore various scenarios.
- Comprehensive Data: Pre-loaded financial information for Fujian Kuncai Material Technology Co., Ltd. (603826SS) to enhance your analysis.
- Instant DCF Calculations: This template automatically computes Net Present Value (NPV) and intrinsic value.
- Professional and Customizable: A sleek Excel model tailored to meet your valuation requirements.
- Designed for Analysts and Investors: Perfect for evaluating projections, confirming strategies, and optimizing efficiency.
Key Features
- Real-Time FKMT Data: Includes Fujian Kuncai's historical performance metrics and future forecasts.
- Comprehensive Input Customization: Tailor revenue growth rates, profit margins, weighted average cost of capital (WACC), tax rates, and capital expenditure assumptions.
- Advanced Valuation Framework: Automatically refreshes Net Present Value (NPV) and intrinsic value calculations based on your specified inputs.
- Multiple Scenario Analysis: Develop various forecasting scenarios to assess different valuation results.
- Intuitive User Interface: Designed for ease of use, catering to both experienced professionals and newcomers.
How It Operates
- Download the Template: Gain immediate access to the Excel-based Kuncai DCF Calculator for Fujian Kuncai Material Technology Co., Ltd. (603826SS).
- Input Your Assumptions: Modify the yellow-highlighted cells to set growth rates, WACC, margins, and other parameters.
- Instant Calculations: The model will automatically refresh to reflect the intrinsic value of Fujian Kuncai Material Technology Co., Ltd. (603826SS).
- Test Scenarios: Experiment with various assumptions to analyze how valuations may change.
- Analyze and Decide: Leverage the findings to inform your investment or financial decisions.
Why Opt for This Calculator?
- User-Friendly Design: Tailored for both novices and seasoned professionals.
- Customizable Inputs: Easily adjust parameters to suit your analytical needs.
- Real-Time Updates: Observe immediate changes to Fujian Kuncai Material Technology Co., Ltd.'s valuation as you tweak inputs.
- Preconfigured Data: Comes with Fujian Kuncai's actual financial figures for swift analysis.
- Relied Upon by Experts: Utilized by investors and analysts for informed decision-making.
Who Should Use This Product?
- Professional Investors: Develop comprehensive and trustworthy valuation models for analyzing portfolios that include Fujian Kuncai Material Technology Co., Ltd. (603826SS).
- Corporate Finance Teams: Evaluate valuation scenarios to inform strategic decisions within their organizations.
- Consultants and Advisors: Deliver precise valuation insights for clients interested in Fujian Kuncai Material Technology Co., Ltd. (603826SS).
- Students and Educators: Utilize real-world case studies to enhance learning and practice in financial modeling.
- Industry Enthusiasts: Gain insights into how material technology companies, like Fujian Kuncai Material Technology Co., Ltd. (603826SS), are valued in the market.
What the Template Contains
- Pre-Filled Data: Features Fujian Kuncai Material Technology's historical financials and projections.
- Discounted Cash Flow Model: An editable DCF valuation model with automated calculations.
- Weighted Average Cost of Capital (WACC): A dedicated sheet for WACC calculations based on user-defined inputs.
- Key Financial Ratios: Evaluate Fujian Kuncai's profitability, operational efficiency, and financial leverage.
- Customizable Inputs: Easily modify revenue growth rates, profit margins, and tax assumptions.
- Clear Dashboard: Visual representations and tables summarizing essential valuation outcomes.
Disclaimer
All information, articles, and product details provided on this website are for general informational and educational purposes only. We do not claim any ownership over, nor do we intend to infringe upon, any trademarks, copyrights, logos, brand names, or other intellectual property mentioned or depicted on this site. Such intellectual property remains the property of its respective owners, and any references here are made solely for identification or informational purposes, without implying any affiliation, endorsement, or partnership.
We make no representations or warranties, express or implied, regarding the accuracy, completeness, or suitability of any content or products presented. Nothing on this website should be construed as legal, tax, investment, financial, medical, or other professional advice. In addition, no part of this site—including articles or product references—constitutes a solicitation, recommendation, endorsement, advertisement, or offer to buy or sell any securities, franchises, or other financial instruments, particularly in jurisdictions where such activity would be unlawful.
All content is of a general nature and may not address the specific circumstances of any individual or entity. It is not a substitute for professional advice or services. Any actions you take based on the information provided here are strictly at your own risk. You accept full responsibility for any decisions or outcomes arising from your use of this website and agree to release us from any liability in connection with your use of, or reliance upon, the content or products found herein.