
|
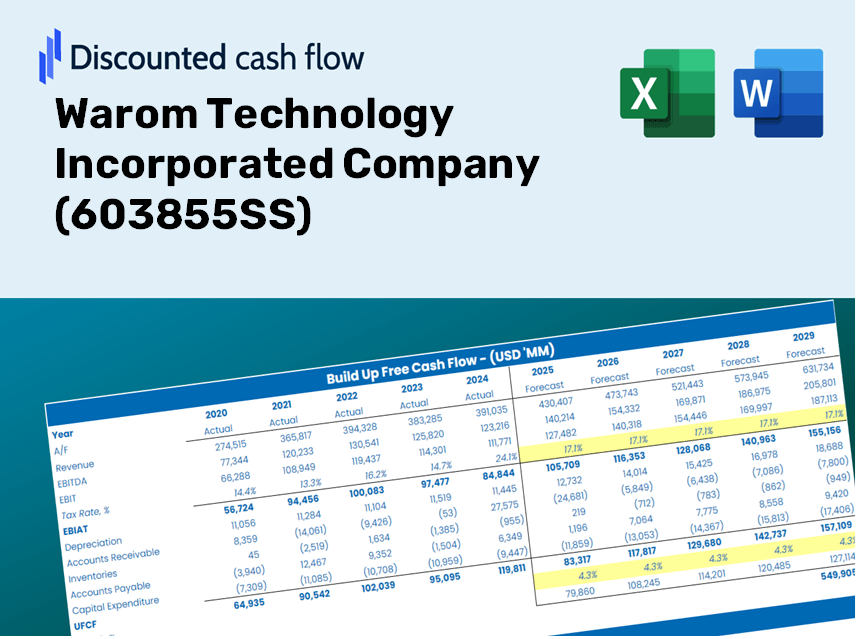
Warom Technology Incorporated Company (603855.SS) DCF Valuation |
Totalmente Editável: Adapte-Se Às Suas Necessidades No Excel Ou Planilhas
Design Profissional: Modelos Confiáveis E Padrão Da Indústria
Pré-Construídos Para Uso Rápido E Eficiente
Compatível com MAC/PC, totalmente desbloqueado
Não É Necessária Experiência; Fácil De Seguir
Warom Technology Incorporated Company (603855.SS) Bundle
Evaluate the financial outlook of Warom Technology Incorporated Company like an expert! This (603855SS) DCF Calculator provides pre-filled financial data and allows you to easily modify revenue growth, WACC, margins, and other crucial assumptions to align with your projections.
Discounted Cash Flow (DCF) - (USD MM)
| Year | AY1 2020 |
AY2 2021 |
AY3 2022 |
AY4 2023 |
AY5 2024 |
FY1 2025 |
FY2 2026 |
FY3 2027 |
FY4 2028 |
FY5 2029 |
|---|---|---|---|---|---|---|---|---|---|---|
| Revenue | 2,282.7 | 3,027.3 | 3,042.9 | 3,196.9 | 3,964.4 | 4,580.9 | 5,293.3 | 6,116.4 | 7,067.6 | 8,166.6 |
| Revenue Growth, % | 0 | 32.62 | 0.51607 | 5.06 | 24.01 | 15.55 | 15.55 | 15.55 | 15.55 | 15.55 |
| EBITDA | 356.9 | 493.5 | 467.1 | 583.1 | 596.3 | 738.1 | 852.9 | 985.5 | 1,138.8 | 1,315.9 |
| EBITDA, % | 15.63 | 16.3 | 15.35 | 18.24 | 15.04 | 16.11 | 16.11 | 16.11 | 16.11 | 16.11 |
| Depreciation | 47.8 | 54.3 | 60.9 | 57.8 | 64.1 | 85.3 | 98.6 | 113.9 | 131.7 | 152.1 |
| Depreciation, % | 2.09 | 1.79 | 2 | 1.81 | 1.62 | 1.86 | 1.86 | 1.86 | 1.86 | 1.86 |
| EBIT | 309.1 | 439.2 | 406.2 | 525.3 | 532.2 | 652.8 | 754.3 | 871.6 | 1,007.1 | 1,163.8 |
| EBIT, % | 13.54 | 14.51 | 13.35 | 16.43 | 13.42 | 14.25 | 14.25 | 14.25 | 14.25 | 14.25 |
| Total Cash | 801.4 | 939.3 | 735.0 | 1,004.6 | 959.8 | 1,336.9 | 1,544.8 | 1,785.1 | 2,062.7 | 2,383.4 |
| Total Cash, percent | .0 | .0 | .0 | .0 | .0 | .0 | .0 | .0 | .0 | .0 |
| Account Receivables | 1,385.7 | 1,555.1 | 1,937.3 | 2,001.2 | 2,436.3 | 2,746.7 | 3,173.8 | 3,667.3 | 4,237.6 | 4,896.6 |
| Account Receivables, % | 60.7 | 51.37 | 63.67 | 62.6 | 61.46 | 59.96 | 59.96 | 59.96 | 59.96 | 59.96 |
| Inventories | 472.0 | 820.1 | 747.9 | 698.9 | 884.7 | 1,067.5 | 1,233.6 | 1,425.4 | 1,647.0 | 1,903.2 |
| Inventories, % | 20.68 | 27.09 | 24.58 | 21.86 | 22.32 | 23.3 | 23.3 | 23.3 | 23.3 | 23.3 |
| Accounts Payable | 546.5 | 980.4 | 866.6 | 841.9 | 1,346.8 | 1,329.5 | 1,536.3 | 1,775.2 | 2,051.2 | 2,370.2 |
| Accounts Payable, % | 23.94 | 32.39 | 28.48 | 26.33 | 33.97 | 29.02 | 29.02 | 29.02 | 29.02 | 29.02 |
| Capital Expenditure | -113.3 | -102.5 | -57.2 | -77.4 | -145.9 | -149.6 | -172.9 | -199.8 | -230.8 | -266.7 |
| Capital Expenditure, % | -4.96 | -3.39 | -1.88 | -2.42 | -3.68 | -3.27 | -3.27 | -3.27 | -3.27 | -3.27 |
| Tax Rate, % | 12.55 | 12.55 | 12.55 | 12.55 | 12.55 | 12.55 | 12.55 | 12.55 | 12.55 | 12.55 |
| EBITAT | 262.7 | 383.7 | 363.5 | 463.7 | 465.4 | 571.3 | 660.1 | 762.8 | 881.4 | 1,018.4 |
| Depreciation | ||||||||||
| Changes in Account Receivables | ||||||||||
| Changes in Inventories | ||||||||||
| Changes in Accounts Payable | ||||||||||
| Capital Expenditure | ||||||||||
| UFCF | -1,113.9 | 251.7 | -56.5 | 404.4 | 267.6 | -3.5 | 199.5 | 230.5 | 266.3 | 307.7 |
| WACC, % | 7.08 | 7.08 | 7.08 | 7.08 | 7.08 | 7.08 | 7.08 | 7.08 | 7.08 | 7.08 |
| PV UFCF | ||||||||||
| SUM PV UFCF | 779.5 | |||||||||
| Long Term Growth Rate, % | 3.50 | |||||||||
| Free cash flow (T + 1) | 318 | |||||||||
| Terminal Value | 8,899 | |||||||||
| Present Terminal Value | 6,322 | |||||||||
| Enterprise Value | 7,101 | |||||||||
| Net Debt | -863 | |||||||||
| Equity Value | 7,965 | |||||||||
| Diluted Shares Outstanding, MM | 340 | |||||||||
| Equity Value Per Share | 23.43 |
What You Will Receive
- Authentic 603855SS Financial Data: Preloaded with Warom Technology’s historical and projected metrics for detailed analysis.
- Fully Customizable Template: Effortlessly adjust essential inputs such as revenue growth, WACC, and EBITDA percentage.
- Instant Calculations: Watch Warom Technology’s intrinsic value refresh automatically as you make adjustments.
- Professional Valuation Tool: Tailored for investors, analysts, and consultants aiming for precise DCF outcomes.
- User-Friendly Interface: Intuitive layout and straightforward guidance suitable for all skill levels.
Key Features
- Comprehensive DCF Calculator: Offers in-depth unlevered and levered DCF valuation models tailored for Warom Technology Incorporated (603855SS).
- WACC Calculation Tool: Features a user-friendly Weighted Average Cost of Capital sheet with adjustable parameters.
- Customizable Forecast Assumptions: Allows alterations to growth rates, capital expenditures, and discount rates as needed.
- Integrated Financial Ratios: Evaluate profitability, leverage, and efficiency ratios specifically for Warom Technology (603855SS).
- Interactive Dashboard and Charts: Visual representations that condense key valuation metrics for straightforward analysis.
How It Functions
- Download the Template: Gain immediate access to the Excel-based Warom Technology (603855SS) DCF Calculator.
- Input Your Assumptions: Modify the yellow-highlighted cells for growth rates, WACC, margins, and other variables.
- Instant Calculations: The model automatically updates the intrinsic value of Warom Technology (603855SS).
- Test Scenarios: Simulate various assumptions to assess potential changes in valuation.
- Analyze and Decide: Utilize the results to inform your investment or financial analysis.
Why Select This Calculator for Warom Technology Inc. (603855SS)?
- Precision: Utilizes accurate financial data from Warom for reliable results.
- Adaptability: Allows users to easily test and adjust inputs as needed.
- Efficiency: Eliminates the need to build a DCF model from the ground up.
- CFO-Level Quality: Crafted with the expertise and usability expected at the executive level.
- Intuitive Design: Simple to navigate, even for those with limited financial modeling skills.
Who Can Benefit from This Product?
- Investors: Evaluate Warom Technology's valuation prior to stock transactions.
- CFOs and Financial Analysts: Enhance valuation workflows and validate financial forecasts.
- Startup Founders: Gain insights into how leading public companies like Warom Technology are appraised.
- Consultants: Produce comprehensive valuation reports for your clientele.
- Students and Educators: Apply real-market data to master and convey valuation methodologies.
Contents of the Template
- Comprehensive DCF Model: Editable template featuring in-depth valuation calculations.
- Real-World Data: Historical and projected financials for Warom Technology Incorporated Company (603855SS) preloaded for your analysis.
- Customizable Parameters: Modify WACC, growth rates, and tax assumptions to explore different scenarios.
- Financial Statements: Complete annual and quarterly breakdowns for enhanced insights.
- Key Ratios: Integrated analysis for assessing profitability, efficiency, and leverage.
- Dashboard with Visual Outputs: Includes charts and tables for clear and actionable results.
Disclaimer
All information, articles, and product details provided on this website are for general informational and educational purposes only. We do not claim any ownership over, nor do we intend to infringe upon, any trademarks, copyrights, logos, brand names, or other intellectual property mentioned or depicted on this site. Such intellectual property remains the property of its respective owners, and any references here are made solely for identification or informational purposes, without implying any affiliation, endorsement, or partnership.
We make no representations or warranties, express or implied, regarding the accuracy, completeness, or suitability of any content or products presented. Nothing on this website should be construed as legal, tax, investment, financial, medical, or other professional advice. In addition, no part of this site—including articles or product references—constitutes a solicitation, recommendation, endorsement, advertisement, or offer to buy or sell any securities, franchises, or other financial instruments, particularly in jurisdictions where such activity would be unlawful.
All content is of a general nature and may not address the specific circumstances of any individual or entity. It is not a substitute for professional advice or services. Any actions you take based on the information provided here are strictly at your own risk. You accept full responsibility for any decisions or outcomes arising from your use of this website and agree to release us from any liability in connection with your use of, or reliance upon, the content or products found herein.