
|
Jiangsu Dingsheng New Material Joint-Stoque Co., Ltd (603876.SS) Avaliação DCF |
Totalmente Editável: Adapte-Se Às Suas Necessidades No Excel Ou Planilhas
Design Profissional: Modelos Confiáveis E Padrão Da Indústria
Pré-Construídos Para Uso Rápido E Eficiente
Compatível com MAC/PC, totalmente desbloqueado
Não É Necessária Experiência; Fácil De Seguir
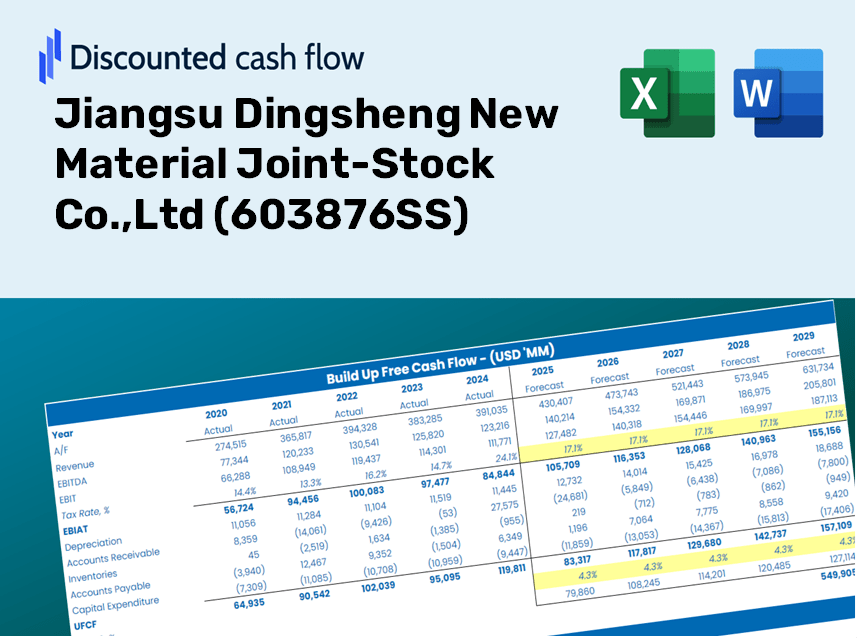
Jiangsu Dingsheng New Material Joint-Stock Co.,Ltd (603876.SS) Bundle
Aprimore suas opções de investimento com a calculadora DCF (603876SS)! Explore dados financeiros genuínos para Jiangsu Dingsheng New Material Joint-Stock Co., LTD, ajuste as projeções e despesas de crescimento e observe instantaneamente como essas modificações afetam o valor intrínseco da empresa.
Discounted Cash Flow (DCF) - (USD MM)
| Year | AY1 2020 |
AY2 2021 |
AY3 2022 |
AY4 2023 |
AY5 2024 |
FY1 2025 |
FY2 2026 |
FY3 2027 |
FY4 2028 |
FY5 2029 |
|---|---|---|---|---|---|---|---|---|---|---|
| Revenue | 12,426.6 | 18,167.9 | 21,605.3 | 19,064.1 | 24,021.7 | 28,787.9 | 34,499.8 | 41,345.0 | 49,548.4 | 59,379.5 |
| Revenue Growth, % | 0 | 46.2 | 18.92 | -11.76 | 26.01 | 19.84 | 19.84 | 19.84 | 19.84 | 19.84 |
| EBITDA | 689.3 | 1,335.7 | 2,427.5 | 1,198.0 | 1,117.7 | 2,019.3 | 2,419.9 | 2,900.1 | 3,475.5 | 4,165.1 |
| EBITDA, % | 5.55 | 7.35 | 11.24 | 6.28 | 4.65 | 7.01 | 7.01 | 7.01 | 7.01 | 7.01 |
| Depreciation | 357.9 | 404.7 | 467.7 | 547.6 | 634.9 | 736.3 | 882.4 | 1,057.4 | 1,267.3 | 1,518.7 |
| Depreciation, % | 2.88 | 2.23 | 2.16 | 2.87 | 2.64 | 2.56 | 2.56 | 2.56 | 2.56 | 2.56 |
| EBIT | 331.4 | 931.1 | 1,959.8 | 650.4 | 482.8 | 1,283.0 | 1,537.6 | 1,842.6 | 2,208.2 | 2,646.4 |
| EBIT, % | 2.67 | 5.12 | 9.07 | 3.41 | 2.01 | 4.46 | 4.46 | 4.46 | 4.46 | 4.46 |
| Total Cash | 1,183.7 | 2,431.0 | 7,516.5 | 4,721.6 | 5,453.4 | 6,055.0 | 7,256.4 | 8,696.1 | 10,421.6 | 12,489.3 |
| Total Cash, percent | .0 | .0 | .0 | .0 | .0 | .0 | .0 | .0 | .0 | .0 |
| Account Receivables | 2,620.4 | 3,483.8 | 3,597.2 | 3,106.3 | 4,755.2 | 5,354.6 | 6,417.1 | 7,690.3 | 9,216.1 | 11,044.7 |
| Account Receivables, % | 21.09 | 19.18 | 16.65 | 16.29 | 19.8 | 18.6 | 18.6 | 18.6 | 18.6 | 18.6 |
| Inventories | 2,502.9 | 3,446.5 | 3,452.3 | 3,864.6 | 4,484.2 | 5,413.9 | 6,488.0 | 7,775.4 | 9,318.1 | 11,166.9 |
| Inventories, % | 20.14 | 18.97 | 15.98 | 20.27 | 18.67 | 18.81 | 18.81 | 18.81 | 18.81 | 18.81 |
| Accounts Payable | 1,700.8 | 3,617.6 | 8,069.3 | 5,930.1 | 9,239.7 | 8,090.4 | 9,695.6 | 11,619.4 | 13,924.8 | 16,687.6 |
| Accounts Payable, % | 13.69 | 19.91 | 37.35 | 31.11 | 38.46 | 28.1 | 28.1 | 28.1 | 28.1 | 28.1 |
| Capital Expenditure | -329.7 | -183.0 | -563.4 | -564.5 | -432.2 | -635.0 | -761.0 | -912.0 | -1,092.9 | -1,309.8 |
| Capital Expenditure, % | -2.65 | -1.01 | -2.61 | -2.96 | -1.8 | -2.21 | -2.21 | -2.21 | -2.21 | -2.21 |
| Tax Rate, % | 10.61 | 10.61 | 10.61 | 10.61 | 10.61 | 10.61 | 10.61 | 10.61 | 10.61 | 10.61 |
| EBITAT | -1,058.8 | 796.3 | 1,682.4 | 535.5 | 431.6 | 880.4 | 1,055.1 | 1,264.4 | 1,515.3 | 1,816.0 |
| Depreciation | ||||||||||
| Changes in Account Receivables | ||||||||||
| Changes in Inventories | ||||||||||
| Changes in Accounts Payable | ||||||||||
| Capital Expenditure | ||||||||||
| UFCF | -4,453.1 | 1,127.8 | 5,919.1 | -1,542.0 | 1,675.5 | -1,696.8 | 645.1 | 773.1 | 926.5 | 1,110.3 |
| WACC, % | 4.07 | 5.2 | 5.21 | 5.16 | 5.25 | 4.98 | 4.98 | 4.98 | 4.98 | 4.98 |
| PV UFCF | ||||||||||
| SUM PV UFCF | 1,270.9 | |||||||||
| Long Term Growth Rate, % | 2.00 | |||||||||
| Free cash flow (T + 1) | 1,133 | |||||||||
| Terminal Value | 38,021 | |||||||||
| Present Terminal Value | 29,821 | |||||||||
| Enterprise Value | 31,092 | |||||||||
| Net Debt | -377 | |||||||||
| Equity Value | 31,469 | |||||||||
| Diluted Shares Outstanding, MM | 886 | |||||||||
| Equity Value Per Share | 35.54 |
What You Will Receive
- Adjustable Forecast Inputs: Effortlessly modify key assumptions (growth %, profit margins, WACC) to explore various scenarios.
- Comprehensive Financial Data: Pre-filled financial information for Jiangsu Dingsheng New Material (603876SS) to accelerate your analysis.
- Automated DCF Calculations: The model computes Net Present Value (NPV) and intrinsic values for you automatically.
- Tailored and Professional Design: A refined Excel template that can be customized to fit your valuation requirements.
- Designed for Analysts and Investors: Perfect for evaluating projections, validating strategies, and enhancing efficiency.
Key Features
- 🔍 Real-Life (603876SS) Financials: Pre-filled historical and projected data for Jiangsu Dingsheng New Material Joint-Stock Co., Ltd.
- ✏️ Fully Customizable Inputs: Modify all essential parameters (yellow cells) such as WACC, growth %, and tax rates.
- 📊 Professional DCF Valuation: Integrated formulas compute Jiangsu Dingsheng’s intrinsic value using the Discounted Cash Flow method.
- ⚡ Instant Results: View Jiangsu Dingsheng’s valuation in real-time after making adjustments.
- Scenario Analysis: Evaluate and compare results for different financial assumptions side-by-side.
How It Works
- Step 1: Download the Excel file.
- Step 2: Review the pre-filled data for Jiangsu Dingsheng New Material (603876SS), including historical and projected figures.
- Step 3: Modify key assumptions in the yellow cells based on your insights.
- Step 4: Observe the automatic recalculations reflecting Jiangsu Dingsheng's intrinsic value.
- Step 5: Utilize the results for making informed investment choices or for reporting purposes.
Why Choose Our Tool for Jiangsu Dingsheng New Material Joint-Stock Co., Ltd (603876SS)?
- Precision: Access accurate financial data tailored to Jiangsu Dingsheng's performance.
- Adaptability: Users can easily experiment and adjust inputs to suit their needs.
- Efficiency: Eliminate the time-consuming process of creating a financial model from the ground up.
- Expert-Quality: Built with the expertise and functionality that CFOs demand.
- Intuitive Design: Simple interface perfect for users without extensive financial modeling experience.
Who Can Benefit From This Product?
- Finance Students: Master valuation techniques and apply them to real-world data.
- Academics: Integrate professional models into your research or teaching materials.
- Investors: Validate your assumptions and evaluate valuation outcomes for Jiangsu Dingsheng New Material (603876SS).
- Analysts: Enhance your efficiency with a customizable, pre-built DCF model.
- Small Business Owners: Understand the analytical processes applied to large public companies like Jiangsu Dingsheng New Material.
Contents of the Template
- Historical Data: Includes Jiangsu Dingsheng New Material's past financial performance and baseline forecasts.
- DCF and Levered DCF Models: Comprehensive templates designed to assess the intrinsic value of Jiangsu Dingsheng New Material (603876SS).
- WACC Sheet: Pre-configured calculations for the Weighted Average Cost of Capital.
- Editable Inputs: Adjust key variables such as growth rates, EBITDA percentages, and CAPEX assumptions.
- Quarterly and Annual Statements: An in-depth overview of Jiangsu Dingsheng New Material's financial statements.
- Interactive Dashboard: Dynamically visualize valuation outcomes and future projections.
Disclaimer
All information, articles, and product details provided on this website are for general informational and educational purposes only. We do not claim any ownership over, nor do we intend to infringe upon, any trademarks, copyrights, logos, brand names, or other intellectual property mentioned or depicted on this site. Such intellectual property remains the property of its respective owners, and any references here are made solely for identification or informational purposes, without implying any affiliation, endorsement, or partnership.
We make no representations or warranties, express or implied, regarding the accuracy, completeness, or suitability of any content or products presented. Nothing on this website should be construed as legal, tax, investment, financial, medical, or other professional advice. In addition, no part of this site—including articles or product references—constitutes a solicitation, recommendation, endorsement, advertisement, or offer to buy or sell any securities, franchises, or other financial instruments, particularly in jurisdictions where such activity would be unlawful.
All content is of a general nature and may not address the specific circumstances of any individual or entity. It is not a substitute for professional advice or services. Any actions you take based on the information provided here are strictly at your own risk. You accept full responsibility for any decisions or outcomes arising from your use of this website and agree to release us from any liability in connection with your use of, or reliance upon, the content or products found herein.