
|
Olympic Circuit Technology Co., Ltd (603920.SS) Avaliação DCF |
Totalmente Editável: Adapte-Se Às Suas Necessidades No Excel Ou Planilhas
Design Profissional: Modelos Confiáveis E Padrão Da Indústria
Pré-Construídos Para Uso Rápido E Eficiente
Compatível com MAC/PC, totalmente desbloqueado
Não É Necessária Experiência; Fácil De Seguir
Olympic Circuit Technology Co., Ltd (603920.SS) Bundle
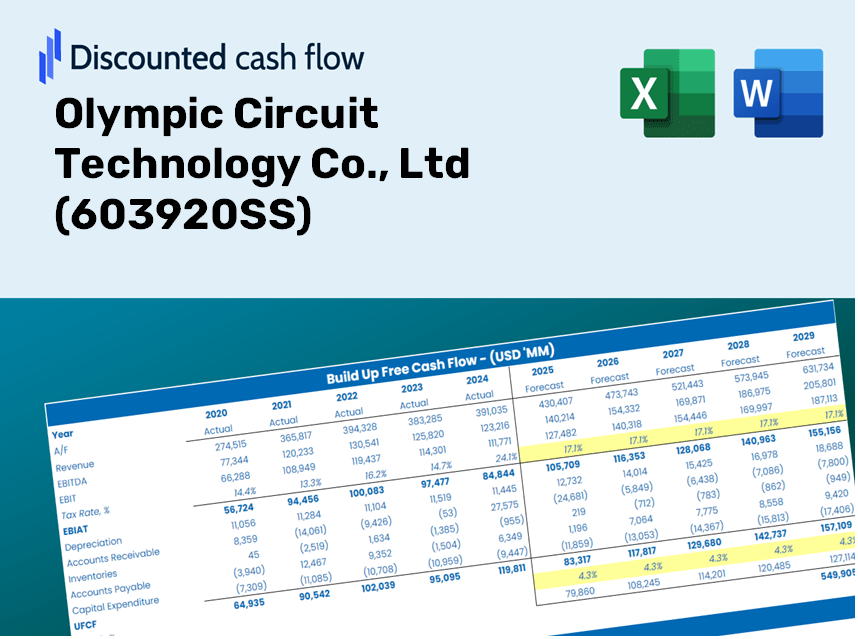
Descubra o verdadeiro potencial da Olympic Circuit Technology Co., Ltd (603920SS) com nossa calculadora DCF avançada! Ajuste as suposições essenciais, explore vários cenários e avalie como as alterações afetam a avaliação do Olympic Circuit Technology Co., LTD (603920SS)-tudo em um modelo de excel amigável.
Discounted Cash Flow (DCF) - (USD MM)
| Year | AY1 2020 |
AY2 2021 |
AY3 2022 |
AY4 2023 |
AY5 2024 |
FY1 2025 |
FY2 2026 |
FY3 2027 |
FY4 2028 |
FY5 2029 |
|---|---|---|---|---|---|---|---|---|---|---|
| Revenue | 2,536.0 | 3,759.2 | 4,432.0 | 4,519.1 | 5,022.0 | 6,016.7 | 7,208.4 | 8,636.1 | 10,346.6 | 12,395.9 |
| Revenue Growth, % | 0 | 48.23 | 17.9 | 1.96 | 11.13 | 19.81 | 19.81 | 19.81 | 19.81 | 19.81 |
| EBITDA | 517.0 | 445.5 | 719.3 | 862.3 | 1,009.9 | 1,054.8 | 1,263.8 | 1,514.1 | 1,814.0 | 2,173.2 |
| EBITDA, % | 20.39 | 11.85 | 16.23 | 19.08 | 20.11 | 17.53 | 17.53 | 17.53 | 17.53 | 17.53 |
| Depreciation | 153.5 | 191.5 | 284.6 | 322.1 | 312.4 | 372.0 | 445.7 | 534.0 | 639.8 | 766.5 |
| Depreciation, % | 6.05 | 5.09 | 6.42 | 7.13 | 6.22 | 6.18 | 6.18 | 6.18 | 6.18 | 6.18 |
| EBIT | 363.5 | 254.0 | 434.7 | 540.3 | 697.4 | 682.8 | 818.0 | 980.1 | 1,174.2 | 1,406.8 |
| EBIT, % | 14.33 | 6.76 | 9.81 | 11.96 | 13.89 | 11.35 | 11.35 | 11.35 | 11.35 | 11.35 |
| Total Cash | 1,250.6 | 1,772.7 | 1,237.3 | 2,014.2 | 4,537.0 | 3,120.3 | 3,738.3 | 4,478.8 | 5,365.8 | 6,428.6 |
| Total Cash, percent | .0 | .0 | .0 | .0 | .0 | .0 | .0 | .0 | .0 | .0 |
| Account Receivables | 739.5 | 1,228.9 | 1,321.9 | 1,314.8 | 1,484.2 | 1,808.9 | 2,167.2 | 2,596.4 | 3,110.6 | 3,726.7 |
| Account Receivables, % | 29.16 | 32.69 | 29.83 | 29.09 | 29.55 | 30.06 | 30.06 | 30.06 | 30.06 | 30.06 |
| Inventories | 218.0 | 553.5 | 461.4 | 421.9 | 547.9 | 649.5 | 778.2 | 932.3 | 1,117.0 | 1,338.2 |
| Inventories, % | 8.6 | 14.72 | 10.41 | 9.34 | 10.91 | 10.8 | 10.8 | 10.8 | 10.8 | 10.8 |
| Accounts Payable | 601.9 | 1,255.2 | 963.4 | 1,173.1 | 1,493.0 | 1,619.1 | 1,939.8 | 2,324.0 | 2,784.3 | 3,335.8 |
| Accounts Payable, % | 23.73 | 33.39 | 21.74 | 25.96 | 29.73 | 26.91 | 26.91 | 26.91 | 26.91 | 26.91 |
| Capital Expenditure | -547.9 | -551.1 | -1,056.3 | -232.2 | -297.9 | -856.4 | -1,026.1 | -1,229.3 | -1,472.8 | -1,764.4 |
| Capital Expenditure, % | -21.61 | -14.66 | -23.83 | -5.14 | -5.93 | -14.23 | -14.23 | -14.23 | -14.23 | -14.23 |
| Tax Rate, % | 8.77 | 8.77 | 8.77 | 8.77 | 8.77 | 8.77 | 8.77 | 8.77 | 8.77 | 8.77 |
| EBITAT | 325.2 | 229.3 | 428.0 | 488.9 | 636.3 | 628.1 | 752.5 | 901.5 | 1,080.1 | 1,294.0 |
| Depreciation | ||||||||||
| Changes in Account Receivables | ||||||||||
| Changes in Inventories | ||||||||||
| Changes in Accounts Payable | ||||||||||
| Capital Expenditure | ||||||||||
| UFCF | -424.9 | -301.7 | -636.5 | 835.1 | 675.3 | -156.5 | 5.9 | 7.1 | 8.5 | 10.2 |
| WACC, % | 6.24 | 6.25 | 6.26 | 6.25 | 6.25 | 6.25 | 6.25 | 6.25 | 6.25 | 6.25 |
| PV UFCF | ||||||||||
| SUM PV UFCF | -121.9 | |||||||||
| Long Term Growth Rate, % | 3.50 | |||||||||
| Free cash flow (T + 1) | 11 | |||||||||
| Terminal Value | 384 | |||||||||
| Present Terminal Value | 283 | |||||||||
| Enterprise Value | 161 | |||||||||
| Net Debt | -1,495 | |||||||||
| Equity Value | 1,657 | |||||||||
| Diluted Shares Outstanding, MM | 649 | |||||||||
| Equity Value Per Share | 2.55 |
What You Will Receive
- Genuine OTC Data: Preloaded financials – covering everything from revenue to EBIT – based on real and projected figures.
- Complete Customization: Modify all essential parameters (yellow cells) such as WACC, growth %, and tax rates.
- Immediate Valuation Adjustments: Automatic recalculations to evaluate the effects of changes on OTC's fair value.
- Flexible Excel Template: Designed for quick modifications, scenario analyses, and comprehensive forecasting.
- Efficient and Precise: Eliminate the need to build models from the ground up while ensuring accuracy and adaptability.
Key Features
- Pre-Loaded Data: Olympic Circuit Technology Co., Ltd's historical financial statements and pre-filled forecasts.
- Fully Adjustable Inputs: Modify WACC, tax rates, revenue growth, and EBITDA margins with ease.
- Instant Results: View the intrinsic value of Olympic Circuit Technology Co., Ltd (603920SS) recalculating in real time.
- Clear Visual Outputs: Dashboard charts showcase valuation results and essential metrics.
- Built for Accuracy: A professional-grade tool designed for analysts, investors, and finance professionals.
How It Functions
- Download: Gain access to a pre-formatted Excel file containing financial data for Olympic Circuit Technology Co., Ltd (603920SS).
- Customize: Tailor your forecasts by adjusting parameters such as revenue growth, EBITDA %, and WACC.
- Real-Time Updates: Watch as intrinsic value and NPV calculations refresh automatically.
- Scenario Testing: Develop various projections and instantly compare their results.
- Informed Decisions: Utilize the valuation insights to shape your investment choices.
Why Choose Olympic Circuit Technology's Calculator?
- Reliable Data: Access precise financial metrics from Olympic Circuit Technology [(603920SS)] for trustworthy valuation outcomes.
- Customizable Options: Tailor essential factors such as growth rates, WACC, and tax rates to fit your forecasts.
- Efficiency Boost: Pre-built calculations save you time by eliminating the need for a fresh start.
- Expert Tool: Crafted for investors, analysts, and consultants seeking professional-grade resources.
- User-Friendly Design: An intuitive interface with clear, step-by-step guidance caters to users of all backgrounds.
Who Should Use Olympic Circuit Technology Co., Ltd ([603920SS])?
- Individual Investors: Gain insights for making informed decisions regarding investment in Olympic Circuit Technology Co., Ltd shares.
- Financial Analysts: Enhance valuation workflows with pre-built financial models tailored for Olympic Circuit Technology Co., Ltd.
- Consultants: Provide clients with accurate and timely valuation analyses related to Olympic Circuit Technology Co., Ltd.
- Business Owners: Learn about the valuation methods of successful companies like Olympic Circuit Technology Co., Ltd to inform your own business strategies.
- Finance Students: Explore valuation methodologies using the real data and cases from Olympic Circuit Technology Co., Ltd.
Contents of the Template
- Pre-Filled DCF Model: Olympic Circuit Technology Co., Ltd's financial data preloaded for immediate application.
- WACC Calculator: Comprehensive calculations for the Weighted Average Cost of Capital.
- Financial Ratios: Assess the company’s profitability, leverage, and efficiency.
- Editable Inputs: Modify assumptions such as growth rates, profit margins, and CAPEX to suit your scenarios.
- Financial Statements: Access annual and quarterly reports for in-depth analysis.
- Interactive Dashboard: Effortlessly visualize important valuation metrics and outcomes.
Disclaimer
All information, articles, and product details provided on this website are for general informational and educational purposes only. We do not claim any ownership over, nor do we intend to infringe upon, any trademarks, copyrights, logos, brand names, or other intellectual property mentioned or depicted on this site. Such intellectual property remains the property of its respective owners, and any references here are made solely for identification or informational purposes, without implying any affiliation, endorsement, or partnership.
We make no representations or warranties, express or implied, regarding the accuracy, completeness, or suitability of any content or products presented. Nothing on this website should be construed as legal, tax, investment, financial, medical, or other professional advice. In addition, no part of this site—including articles or product references—constitutes a solicitation, recommendation, endorsement, advertisement, or offer to buy or sell any securities, franchises, or other financial instruments, particularly in jurisdictions where such activity would be unlawful.
All content is of a general nature and may not address the specific circumstances of any individual or entity. It is not a substitute for professional advice or services. Any actions you take based on the information provided here are strictly at your own risk. You accept full responsibility for any decisions or outcomes arising from your use of this website and agree to release us from any liability in connection with your use of, or reliance upon, the content or products found herein.