
|
Bomin Electronics Co., Ltd. (603936.SS) Avaliação DCF |
Totalmente Editável: Adapte-Se Às Suas Necessidades No Excel Ou Planilhas
Design Profissional: Modelos Confiáveis E Padrão Da Indústria
Pré-Construídos Para Uso Rápido E Eficiente
Compatível com MAC/PC, totalmente desbloqueado
Não É Necessária Experiência; Fácil De Seguir
Bomin Electronics Co., Ltd. (603936.SS) Bundle
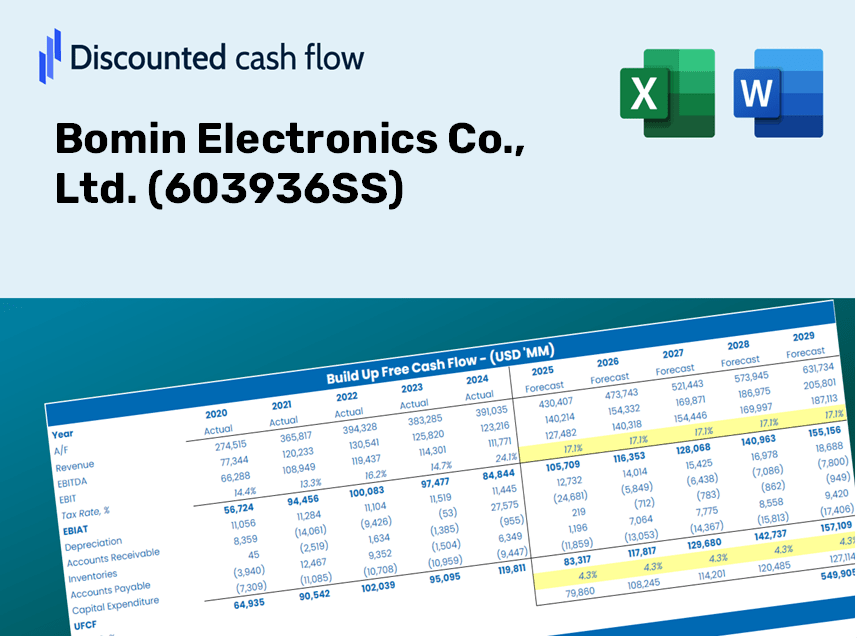
Seja você um investidor ou analista, esta (603936SS) calculadora DCF é o seu recurso preferido para uma avaliação precisa. Carregado com dados reais da Bomin Electronics Co., Ltd., você pode ajustar as previsões e observar imediatamente os efeitos.
Discounted Cash Flow (DCF) - (USD MM)
| Year | AY1 2020 |
AY2 2021 |
AY3 2022 |
AY4 2023 |
AY5 2024 |
FY1 2025 |
FY2 2026 |
FY3 2027 |
FY4 2028 |
FY5 2029 |
|---|---|---|---|---|---|---|---|---|---|---|
| Revenue | 2,785.5 | 3,520.7 | 2,898.2 | 2,913.3 | 3,266.2 | 3,440.6 | 3,624.2 | 3,817.6 | 4,021.4 | 4,236.0 |
| Revenue Growth, % | 0 | 26.39 | -17.68 | 0.52204 | 12.11 | 5.34 | 5.34 | 5.34 | 5.34 | 5.34 |
| EBITDA | 450.7 | 481.7 | 346.4 | 147.5 | 132.9 | 350.6 | 369.3 | 389.0 | 409.7 | 431.6 |
| EBITDA, % | 16.18 | 13.68 | 11.95 | 5.06 | 4.07 | 10.19 | 10.19 | 10.19 | 10.19 | 10.19 |
| Depreciation | 155.0 | 173.0 | 211.9 | 242.9 | 281.7 | 239.2 | 251.9 | 265.4 | 279.5 | 294.4 |
| Depreciation, % | 5.57 | 4.91 | 7.31 | 8.34 | 8.63 | 6.95 | 6.95 | 6.95 | 6.95 | 6.95 |
| EBIT | 295.6 | 308.7 | 134.6 | -95.5 | -148.8 | 111.4 | 117.4 | 123.6 | 130.2 | 137.2 |
| EBIT, % | 10.61 | 8.77 | 4.64 | -3.28 | -4.56 | 3.24 | 3.24 | 3.24 | 3.24 | 3.24 |
| Total Cash | 919.3 | 606.9 | 483.9 | 415.4 | 814.3 | 730.3 | 769.2 | 810.3 | 853.5 | 899.1 |
| Total Cash, percent | .0 | .0 | .0 | .0 | .0 | .0 | .0 | .0 | .0 | .0 |
| Account Receivables | 1,186.3 | 1,444.8 | 1,290.7 | 1,306.6 | 1,722.3 | 1,553.3 | 1,636.2 | 1,723.6 | 1,815.6 | 1,912.4 |
| Account Receivables, % | 42.59 | 41.04 | 44.53 | 44.85 | 52.73 | 45.15 | 45.15 | 45.15 | 45.15 | 45.15 |
| Inventories | 374.3 | 531.8 | 488.6 | 507.4 | 541.5 | 546.3 | 575.5 | 606.2 | 638.6 | 672.6 |
| Inventories, % | 13.44 | 15.11 | 16.86 | 17.42 | 16.58 | 15.88 | 15.88 | 15.88 | 15.88 | 15.88 |
| Accounts Payable | 824.4 | 1,478.5 | 882.1 | 989.0 | 1,549.0 | 1,262.0 | 1,329.3 | 1,400.3 | 1,475.0 | 1,553.7 |
| Accounts Payable, % | 29.6 | 41.99 | 30.44 | 33.95 | 47.42 | 36.68 | 36.68 | 36.68 | 36.68 | 36.68 |
| Capital Expenditure | -306.1 | -639.1 | -791.9 | -996.2 | -1,098.7 | -855.3 | -901.0 | -949.1 | -999.7 | -1,053.1 |
| Capital Expenditure, % | -10.99 | -18.15 | -27.32 | -34.2 | -33.64 | -24.86 | -24.86 | -24.86 | -24.86 | -24.86 |
| Tax Rate, % | -14.65 | -14.65 | -14.65 | -14.65 | -14.65 | -14.65 | -14.65 | -14.65 | -14.65 | -14.65 |
| EBITAT | 257.6 | 270.8 | 115.3 | -91.6 | -170.6 | 101.7 | 107.1 | 112.9 | 118.9 | 125.2 |
| Depreciation | ||||||||||
| Changes in Account Receivables | ||||||||||
| Changes in Inventories | ||||||||||
| Changes in Accounts Payable | ||||||||||
| Capital Expenditure | ||||||||||
| UFCF | -629.6 | 42.8 | -863.9 | -772.7 | -877.4 | -637.3 | -586.6 | -617.9 | -650.9 | -685.6 |
| WACC, % | 7.43 | 7.44 | 7.42 | 7.52 | 7.56 | 7.48 | 7.48 | 7.48 | 7.48 | 7.48 |
| PV UFCF | ||||||||||
| SUM PV UFCF | -2,564.5 | |||||||||
| Long Term Growth Rate, % | 4.00 | |||||||||
| Free cash flow (T + 1) | -713 | |||||||||
| Terminal Value | -20,515 | |||||||||
| Present Terminal Value | -14,306 | |||||||||
| Enterprise Value | -16,870 | |||||||||
| Net Debt | 1,707 | |||||||||
| Equity Value | -18,577 | |||||||||
| Diluted Shares Outstanding, MM | 621 | |||||||||
| Equity Value Per Share | -29.92 |
Benefits You Will Receive
- Customizable Excel Template: A fully adjustable Excel-based DCF Calculator featuring pre-filled financial data for Bomin Electronics Co., Ltd. (603936SS).
- Accurate Data: Access to historical performance data and future projections (highlighted in the yellow cells).
- Flexible Forecasting: Adapt key assumptions such as revenue growth, EBITDA percentage, and WACC as needed.
- Instant Calculations: Quickly assess how your inputs influence the valuation of Bomin Electronics Co., Ltd. (603936SS).
- Professional Resource: Designed for investors, CFOs, consultants, and financial analysts alike.
- Intuitive Layout: Organized for straightforward navigation and usability, complete with step-by-step guidance.
Key Features
- Comprehensive Financial Data: Bomin Electronics Co., Ltd.'s historical financial reports and pre-filled projections.
- Customizable Parameters: Adjust WACC, tax rates, revenue growth, and EBITDA margins as needed.
- Real-Time Calculations: Instantly view the recalculated intrinsic value of Bomin Electronics (603936SS).
- Intuitive Visualizations: Dashboard graphs showcase valuation results and essential metrics.
- Designed for Precision: A reliable tool for analysts, investors, and finance professionals.
How It Works
- Step 1: Download the Excel file.
- Step 2: Review the pre-entered data for Bomin Electronics (603936SS), including historical and projected figures.
- Step 3: Modify the key assumptions (highlighted in yellow) based on your analysis.
- Step 4: Observe the automatic recalculations for the intrinsic value of Bomin Electronics.
- Step 5: Utilize the results for your investment decisions or reporting needs.
Why Choose Bomin Electronics Calculator?
- Precision: Leverages authentic Bomin financial data for reliable results.
- Versatility: Allows users to easily adjust and test different inputs.
- Efficiency: Bypass the complexities of creating a financial model from the ground up.
- Industry-Standard: Crafted with the expertise and accuracy expected at the CFO level.
- Intuitive Design: Simple to navigate, suitable for users without extensive financial modeling skills.
Who Can Benefit from Bomin Electronics Co., Ltd. (603936SS)?
- Engineering Students: Explore electronic design principles and apply them to real-world projects.
- Researchers: Integrate industry-standard electronics models into your studies or publications.
- Investors: Validate your investment strategies and evaluate the performance of Bomin Electronics Co., Ltd. (603936SS).
- Product Analysts: Enhance your analysis with a flexible, pre-configured electronics performance model.
- Entrepreneurs: Understand how major electronics firms like Bomin Electronics Co., Ltd. (603936SS) are assessed in the market.
Contents of the Template
- Pre-Filled DCF Model: Financial data for Bomin Electronics Co., Ltd. (603936SS) preloaded for immediate use.
- WACC Calculator: Comprehensive calculations for the Weighted Average Cost of Capital.
- Financial Ratios: Assess Bomin Electronics' profitability, leverage, and operational efficiency.
- Editable Inputs: Adjust assumptions including growth rates, profit margins, and CAPEX to suit your specific scenarios.
- Financial Statements: Access annual and quarterly reports for thorough analysis.
- Interactive Dashboard: Effectively visualize essential valuation metrics and outcomes.
Disclaimer
All information, articles, and product details provided on this website are for general informational and educational purposes only. We do not claim any ownership over, nor do we intend to infringe upon, any trademarks, copyrights, logos, brand names, or other intellectual property mentioned or depicted on this site. Such intellectual property remains the property of its respective owners, and any references here are made solely for identification or informational purposes, without implying any affiliation, endorsement, or partnership.
We make no representations or warranties, express or implied, regarding the accuracy, completeness, or suitability of any content or products presented. Nothing on this website should be construed as legal, tax, investment, financial, medical, or other professional advice. In addition, no part of this site—including articles or product references—constitutes a solicitation, recommendation, endorsement, advertisement, or offer to buy or sell any securities, franchises, or other financial instruments, particularly in jurisdictions where such activity would be unlawful.
All content is of a general nature and may not address the specific circumstances of any individual or entity. It is not a substitute for professional advice or services. Any actions you take based on the information provided here are strictly at your own risk. You accept full responsibility for any decisions or outcomes arising from your use of this website and agree to release us from any liability in connection with your use of, or reliance upon, the content or products found herein.