
|
Hangzhou Haoyue Personal Care Co., Ltd (605009.SS) Avaliação DCF |
Totalmente Editável: Adapte-Se Às Suas Necessidades No Excel Ou Planilhas
Design Profissional: Modelos Confiáveis E Padrão Da Indústria
Pré-Construídos Para Uso Rápido E Eficiente
Compatível com MAC/PC, totalmente desbloqueado
Não É Necessária Experiência; Fácil De Seguir
Hangzhou Haoyue Personal Care Co., Ltd (605009.SS) Bundle
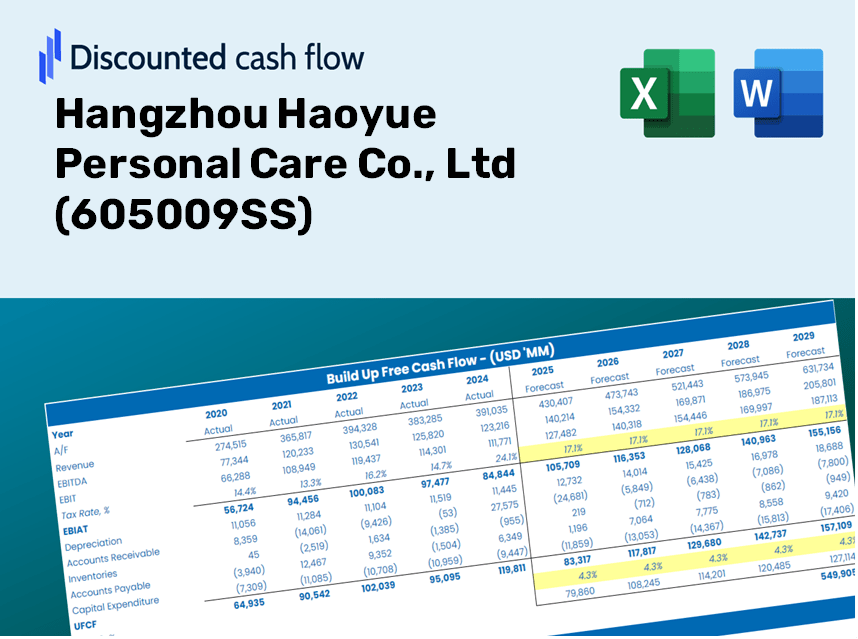
Seja você um investidor ou analista, esta (605009SS) calculadora DCF é o seu recurso preferido para uma avaliação precisa. Equipado com dados reais da Hangzhou Haoyue Personal Care Co., LTD, você pode ajustar facilmente as previsões e observar os resultados em tempo real.
Benefits You Will Receive
- Authentic Haoyue Financials: Comprehensive historical and projected data for precise valuation.
- Customizable Inputs: Adjust key variables such as WACC, tax rates, revenue growth, and capital expenditures.
- Real-Time Calculations: Dynamic computation of intrinsic value and NPV.
- Scenario Analysis: Evaluate various scenarios to assess the future outlook of Hangzhou Haoyue (605009SS).
- User-Friendly Design: Designed for professionals while remaining easy to navigate for newcomers.
Key Features
- 🔍 Real-Life HYC Financials: Pre-filled historical and projected data for Hangzhou Haoyue Personal Care Co., Ltd (605009SS).
- ✏️ Fully Customizable Inputs: Modify all essential parameters (yellow cells) such as WACC, growth %, and tax rates.
- 📊 Professional DCF Valuation: Integrated formulas assess Hangzhou Haoyue's intrinsic value using the Discounted Cash Flow method.
- ⚡ Instant Results: Visualize Hangzhou Haoyue's valuation immediately after adjustments.
- Scenario Analysis: Evaluate and compare different outcomes based on various financial assumptions side-by-side.
How It Works
- Step 1: Download the prebuilt Excel template containing Hangzhou Haoyue Personal Care Co., Ltd's (605009SS) data.
- Step 2: Review the pre-filled sheets to familiarize yourself with the essential metrics.
- Step 3: Modify forecasts and assumptions in the editable yellow cells (WACC, growth, margins).
- Step 4: Instantly see the recalculated results, including the intrinsic value of Hangzhou Haoyue Personal Care Co., Ltd (605009SS).
- Step 5: Make informed investment choices or create reports based on the generated outputs.
Why Opt for Hangzhou Haoyue Personal Care Co., Ltd (605009SS)?
- Save Time: Instantly access our comprehensive personal care solutions without the hassle of starting from zero.
- Enhance Quality: Our high-quality ingredients and processes ensure exceptional results.
- Fully Customizable: Adapt our product offerings to meet your specific needs and preferences.
- Easy to Understand: User-friendly packaging and information make it simple to navigate our products.
- Endorsed by Professionals: Trusted by industry experts who prioritize excellence and effectiveness.
Who Can Benefit from Our Products?
- Beauty Industry Professionals: Create comprehensive and dependable product analysis for market evaluations.
- Corporate Marketing Teams: Explore market trends to inform strategic branding decisions.
- Consultants and Advisors: Offer clients precise insights into the valuation of Hangzhou Haoyue Personal Care Co., Ltd (605009SS).
- Students and Educators: Utilize real-life data to enhance learning and practice in product management.
- Health and Beauty Enthusiasts: Gain a deeper understanding of how personal care brands like Hangzhou Haoyue are assessed in the marketplace.
Contents of the Template
- Pre-Filled DCF Model: Hangzhou Haoyue Personal Care Co., Ltd's (605009SS) financial data preloaded for immediate application.
- WACC Calculator: Comprehensive calculations for the Weighted Average Cost of Capital.
- Financial Ratios: Assess Hangzhou Haoyue’s profitability, leverage, and operational efficiency.
- Editable Inputs: Modify assumptions such as growth rates, profit margins, and capital expenditures to suit your analysis.
- Financial Statements: Annual and quarterly reports provided for thorough evaluation.
- Interactive Dashboard: Visualize essential valuation metrics and outcomes with ease.
Disclaimer
All information, articles, and product details provided on this website are for general informational and educational purposes only. We do not claim any ownership over, nor do we intend to infringe upon, any trademarks, copyrights, logos, brand names, or other intellectual property mentioned or depicted on this site. Such intellectual property remains the property of its respective owners, and any references here are made solely for identification or informational purposes, without implying any affiliation, endorsement, or partnership.
We make no representations or warranties, express or implied, regarding the accuracy, completeness, or suitability of any content or products presented. Nothing on this website should be construed as legal, tax, investment, financial, medical, or other professional advice. In addition, no part of this site—including articles or product references—constitutes a solicitation, recommendation, endorsement, advertisement, or offer to buy or sell any securities, franchises, or other financial instruments, particularly in jurisdictions where such activity would be unlawful.
All content is of a general nature and may not address the specific circumstances of any individual or entity. It is not a substitute for professional advice or services. Any actions you take based on the information provided here are strictly at your own risk. You accept full responsibility for any decisions or outcomes arising from your use of this website and agree to release us from any liability in connection with your use of, or reliance upon, the content or products found herein.