
|
Quechen Silicon Chemical Co., Ltd. (605183.SS) Avaliação DCF |
Totalmente Editável: Adapte-Se Às Suas Necessidades No Excel Ou Planilhas
Design Profissional: Modelos Confiáveis E Padrão Da Indústria
Pré-Construídos Para Uso Rápido E Eficiente
Compatível com MAC/PC, totalmente desbloqueado
Não É Necessária Experiência; Fácil De Seguir
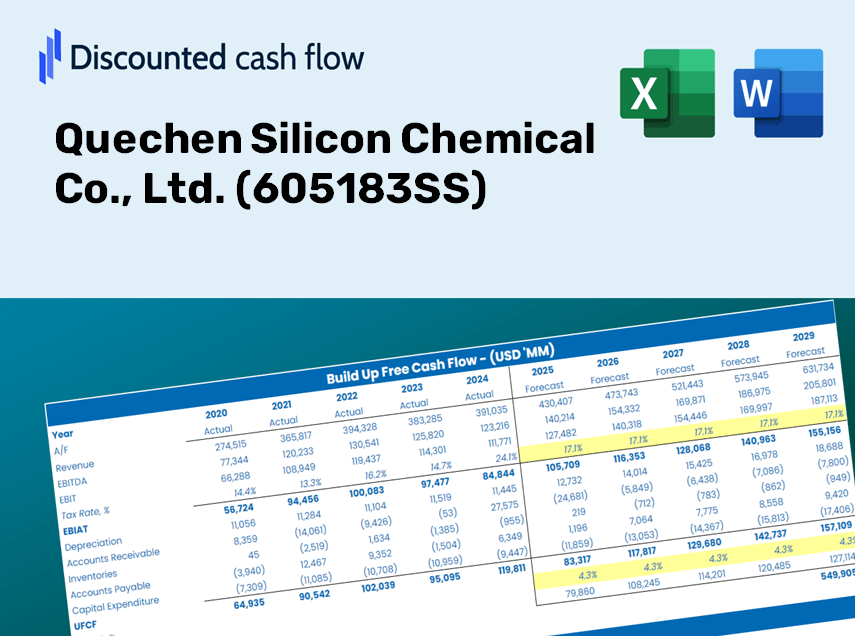
Quechen Silicon Chemical Co., Ltd. (605183.SS) Bundle
Procurando avaliar o valor intrínseco da Quechen Silicon Chemical Co., Ltd.? Nossa calculadora (605183SS) integra dados do mundo real com extensos recursos de personalização, permitindo refinar as previsões e aprimorar suas estratégias de investimento.
Discounted Cash Flow (DCF) - (USD MM)
| Year | AY1 2020 |
AY2 2021 |
AY3 2022 |
AY4 2023 |
AY5 2024 |
FY1 2025 |
FY2 2026 |
FY3 2027 |
FY4 2028 |
FY5 2029 |
|---|---|---|---|---|---|---|---|---|---|---|
| Revenue | 1,055.3 | 1,502.9 | 1,746.5 | 1,810.4 | 2,197.4 | 2,657.0 | 3,212.8 | 3,884.8 | 4,697.3 | 5,679.8 |
| Revenue Growth, % | 0 | 42.42 | 16.2 | 3.66 | 21.38 | 20.92 | 20.92 | 20.92 | 20.92 | 20.92 |
| EBITDA | 335.7 | 439.2 | 422.0 | 469.1 | 655.3 | 748.9 | 905.6 | 1,095.0 | 1,324.0 | 1,600.9 |
| EBITDA, % | 31.82 | 29.22 | 24.16 | 25.91 | 29.82 | 28.19 | 28.19 | 28.19 | 28.19 | 28.19 |
| Depreciation | 74.9 | 75.3 | 77.6 | 80.6 | 93.3 | 134.2 | 162.2 | 196.2 | 237.2 | 286.8 |
| Depreciation, % | 7.1 | 5.01 | 4.44 | 4.45 | 4.24 | 5.05 | 5.05 | 5.05 | 5.05 | 5.05 |
| EBIT | 260.8 | 363.9 | 344.4 | 388.5 | 562.0 | 614.8 | 743.3 | 898.8 | 1,086.8 | 1,314.1 |
| EBIT, % | 24.72 | 24.21 | 19.72 | 21.46 | 25.58 | 23.14 | 23.14 | 23.14 | 23.14 | 23.14 |
| Total Cash | 1,194.3 | 1,038.9 | 801.3 | 808.9 | 819.7 | 1,578.3 | 1,908.4 | 2,307.5 | 2,790.1 | 3,373.7 |
| Total Cash, percent | .0 | .0 | .0 | .0 | .0 | .0 | .0 | .0 | .0 | .0 |
| Account Receivables | 410.2 | 593.6 | 588.4 | 639.5 | 688.6 | 949.8 | 1,148.4 | 1,388.6 | 1,679.0 | 2,030.2 |
| Account Receivables, % | 38.87 | 39.5 | 33.69 | 35.32 | 31.34 | 35.74 | 35.74 | 35.74 | 35.74 | 35.74 |
| Inventories | 116.4 | 169.9 | 228.7 | 182.3 | 227.5 | 296.8 | 358.9 | 433.9 | 524.7 | 634.5 |
| Inventories, % | 11.03 | 11.3 | 13.1 | 10.07 | 10.35 | 11.17 | 11.17 | 11.17 | 11.17 | 11.17 |
| Accounts Payable | 168.6 | 295.6 | 313.0 | 197.2 | 300.4 | 415.2 | 502.0 | 607.0 | 734.0 | 887.5 |
| Accounts Payable, % | 15.98 | 19.67 | 17.92 | 10.89 | 13.67 | 15.63 | 15.63 | 15.63 | 15.63 | 15.63 |
| Capital Expenditure | -165.3 | -130.2 | -196.2 | -218.3 | -364.5 | -341.2 | -412.5 | -498.8 | -603.2 | -729.3 |
| Capital Expenditure, % | -15.67 | -8.66 | -11.23 | -12.06 | -16.59 | -12.84 | -12.84 | -12.84 | -12.84 | -12.84 |
| Tax Rate, % | 14.54 | 14.54 | 14.54 | 14.54 | 14.54 | 14.54 | 14.54 | 14.54 | 14.54 | 14.54 |
| EBITAT | 223.8 | 305.9 | 294.1 | 343.3 | 480.3 | 527.6 | 638.0 | 771.4 | 932.7 | 1,127.8 |
| Depreciation | ||||||||||
| Changes in Account Receivables | ||||||||||
| Changes in Inventories | ||||||||||
| Changes in Accounts Payable | ||||||||||
| Capital Expenditure | ||||||||||
| UFCF | -224.6 | 141.1 | 139.4 | 85.1 | 218.0 | 104.8 | 213.7 | 258.5 | 312.5 | 377.9 |
| WACC, % | 6.57 | 6.57 | 6.57 | 6.57 | 6.57 | 6.57 | 6.57 | 6.57 | 6.57 | 6.57 |
| PV UFCF | ||||||||||
| SUM PV UFCF | 1,017.2 | |||||||||
| Long Term Growth Rate, % | 2.00 | |||||||||
| Free cash flow (T + 1) | 385 | |||||||||
| Terminal Value | 8,430 | |||||||||
| Present Terminal Value | 6,132 | |||||||||
| Enterprise Value | 7,149 | |||||||||
| Net Debt | -740 | |||||||||
| Equity Value | 7,889 | |||||||||
| Diluted Shares Outstanding, MM | 410 | |||||||||
| Equity Value Per Share | 19.26 |
What You Will Receive
- Genuine Quechen Data: Preloaded financials – encompassing revenue to EBIT – derived from both actual and projected data.
- Comprehensive Customization: Modify all essential parameters (highlighted cells) including WACC, growth %, and tax rates.
- Real-Time Valuation Adjustments: Automatic recalculations to assess the impact of changes on the fair value of Quechen Silicon Chemical Co., Ltd. (605183SS).
- Flexible Excel Template: Designed for quick modifications, scenario analysis, and in-depth projections.
- Efficient and Precise: Avoid the hassle of building models from the ground up while ensuring accuracy and adaptability.
Key Features
- Pre-Loaded Data: Quechen Silicon Chemical Co., Ltd.'s historical financial statements and pre-filled forecasts.
- Fully Adjustable Inputs: Modify WACC, tax rates, revenue growth, and EBITDA margins as needed.
- Instant Results: View the intrinsic value of Quechen Silicon Chemical Co., Ltd. recalculating in real time.
- Clear Visual Outputs: Dashboard charts provide a visual representation of valuation results and key metrics.
- Built for Accuracy: A professional-grade tool designed for analysts, investors, and finance experts.
How It Operates
- Download the Template: Gain immediate access to the Excel-based Quechen Silicon DCF Calculator.
- Input Your Assumptions: Modify the yellow-highlighted cells to set your growth rates, WACC, margins, and other variables.
- Instant Calculations: The model promptly recalculates the intrinsic value of Quechen Silicon Chemical Co., Ltd. (605183SS).
- Test Scenarios: Experiment with various assumptions to assess potential changes in valuation.
- Analyze and Decide: Leverage the outcomes to inform your investment or financial strategy.
Why Opt for Quechen Silicon Chemical Co., Ltd. Calculator?
- Precise Information: Up-to-date financial data from Quechen ensures trustworthy valuation outcomes.
- Tailorable: Modify essential parameters such as growth rates, WACC, and tax rates to align with your forecasts.
- Efficient: Ready-made calculations save you the hassle of starting from the ground up.
- Expert-Level Tool: Crafted for investors, analysts, and consultants alike.
- Easy to Use: User-friendly design and clear instructions make it accessible for everyone.
Who Can Benefit from Quechen Silicon Chemical Co., Ltd. (605183SS)?
- Investors: Enhance your investment strategy with reliable insights from a leading silicon chemical producer.
- Market Analysts: Streamline your research using ready-to-analyze data from a trusted industry player.
- Consultants: Easily tailor reports and presentations based on comprehensive market information.
- Industry Enthusiasts: Expand your knowledge of silicon chemical applications through detailed case studies.
- Educators and Students: Leverage real-world examples to enrich learning in chemistry and business courses.
Contents of the Template
- Operating and Balance Sheet Data: Pre-filled historical data and forecasts for Quechen Silicon Chemical Co., Ltd. (605183SS), including revenue, EBITDA, EBIT, and capital expenditures.
- WACC Calculation: A dedicated sheet for Weighted Average Cost of Capital (WACC), featuring key parameters such as Beta, risk-free rate, and share price.
- DCF Valuation (Unlevered and Levered): Customizable Discounted Cash Flow models detailing intrinsic value with thorough calculations.
- Financial Statements: Pre-loaded annual and quarterly financial statements to facilitate analysis.
- Key Ratios: Includes profitability, leverage, and efficiency ratios relevant to Quechen Silicon Chemical Co., Ltd. (605183SS).
- Dashboard and Charts: Visual representation of valuation outputs and assumptions for easy analysis of results.
Disclaimer
All information, articles, and product details provided on this website are for general informational and educational purposes only. We do not claim any ownership over, nor do we intend to infringe upon, any trademarks, copyrights, logos, brand names, or other intellectual property mentioned or depicted on this site. Such intellectual property remains the property of its respective owners, and any references here are made solely for identification or informational purposes, without implying any affiliation, endorsement, or partnership.
We make no representations or warranties, express or implied, regarding the accuracy, completeness, or suitability of any content or products presented. Nothing on this website should be construed as legal, tax, investment, financial, medical, or other professional advice. In addition, no part of this site—including articles or product references—constitutes a solicitation, recommendation, endorsement, advertisement, or offer to buy or sell any securities, franchises, or other financial instruments, particularly in jurisdictions where such activity would be unlawful.
All content is of a general nature and may not address the specific circumstances of any individual or entity. It is not a substitute for professional advice or services. Any actions you take based on the information provided here are strictly at your own risk. You accept full responsibility for any decisions or outcomes arising from your use of this website and agree to release us from any liability in connection with your use of, or reliance upon, the content or products found herein.