
|
HEBEI HUATONG FIRS e CABLES GRUPO CO., LTD. (605196.SS) Avaliação DCF |
Totalmente Editável: Adapte-Se Às Suas Necessidades No Excel Ou Planilhas
Design Profissional: Modelos Confiáveis E Padrão Da Indústria
Pré-Construídos Para Uso Rápido E Eficiente
Compatível com MAC/PC, totalmente desbloqueado
Não É Necessária Experiência; Fácil De Seguir
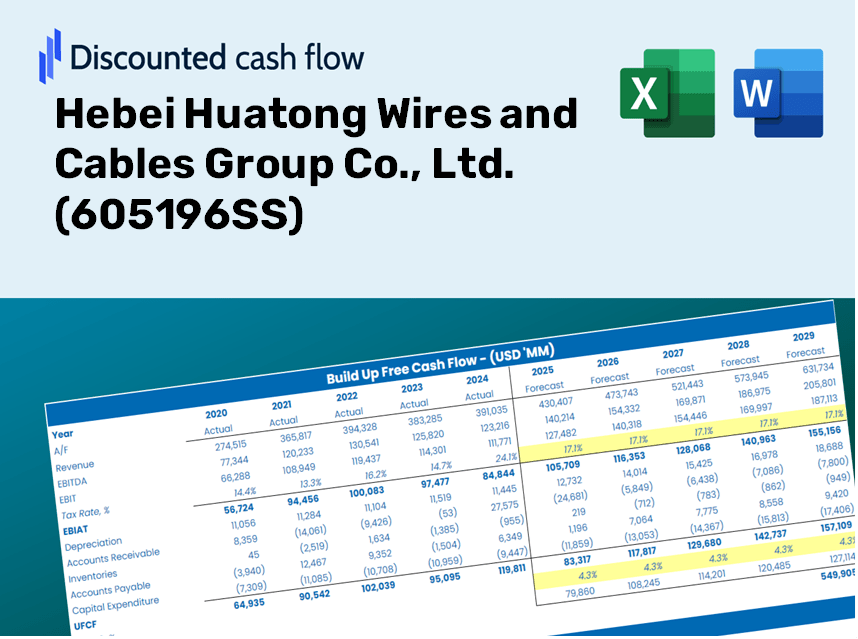
Hebei Huatong Wires and Cables Group Co., Ltd. (605196.SS) Bundle
Seja você um investidor ou analista, esta (605196SS) calculadora DCF é o seu recurso preferido para uma avaliação precisa. Equipado com dados reais da Hebei Huatong Fios e Cables Group Co., Ltd., você pode ajustar as previsões e observar os efeitos em tempo real.
Discounted Cash Flow (DCF) - (USD MM)
| Year | AY1 2020 |
AY2 2021 |
AY3 2022 |
AY4 2023 |
AY5 2024 |
FY1 2025 |
FY2 2026 |
FY3 2027 |
FY4 2028 |
FY5 2029 |
|---|---|---|---|---|---|---|---|---|---|---|
| Revenue | 3,375.8 | 4,397.1 | 5,192.8 | 5,364.1 | 6,346.8 | 7,457.1 | 8,761.5 | 10,294.1 | 12,094.8 | 14,210.5 |
| Revenue Growth, % | 0 | 30.25 | 18.1 | 3.3 | 18.32 | 17.49 | 17.49 | 17.49 | 17.49 | 17.49 |
| EBITDA | 328.2 | 299.7 | 436.1 | 565.4 | 556.0 | 659.8 | 775.2 | 910.8 | 1,070.1 | 1,257.3 |
| EBITDA, % | 9.72 | 6.82 | 8.4 | 10.54 | 8.76 | 8.85 | 8.85 | 8.85 | 8.85 | 8.85 |
| Depreciation | 79.9 | 74.3 | 86.2 | 93.3 | 102.3 | 135.3 | 158.9 | 186.7 | 219.4 | 257.8 |
| Depreciation, % | 2.37 | 1.69 | 1.66 | 1.74 | 1.61 | 1.81 | 1.81 | 1.81 | 1.81 | 1.81 |
| EBIT | 248.3 | 225.4 | 349.8 | 472.1 | 453.7 | 524.5 | 616.2 | 724.0 | 850.7 | 999.5 |
| EBIT, % | 7.36 | 5.13 | 6.74 | 8.8 | 7.15 | 7.03 | 7.03 | 7.03 | 7.03 | 7.03 |
| Total Cash | 411.7 | 575.1 | 1,312.1 | 986.2 | 970.1 | 1,255.9 | 1,475.6 | 1,733.8 | 2,037.1 | 2,393.4 |
| Total Cash, percent | .0 | .0 | .0 | .0 | .0 | .0 | .0 | .0 | .0 | .0 |
| Account Receivables | 1,053.5 | 1,828.5 | 1,762.7 | 1,585.4 | 2,118.0 | 2,530.4 | 2,973.0 | 3,493.1 | 4,104.1 | 4,822.1 |
| Account Receivables, % | 31.21 | 41.58 | 33.95 | 29.56 | 33.37 | 33.93 | 33.93 | 33.93 | 33.93 | 33.93 |
| Inventories | 717.2 | 956.8 | 1,109.7 | 1,193.2 | 1,534.5 | 1,652.4 | 1,941.5 | 2,281.1 | 2,680.1 | 3,148.9 |
| Inventories, % | 21.24 | 21.76 | 21.37 | 22.24 | 24.18 | 22.16 | 22.16 | 22.16 | 22.16 | 22.16 |
| Accounts Payable | 376.6 | 590.2 | 437.2 | 479.4 | 548.9 | 754.4 | 886.4 | 1,041.5 | 1,223.6 | 1,437.7 |
| Accounts Payable, % | 11.16 | 13.42 | 8.42 | 8.94 | 8.65 | 10.12 | 10.12 | 10.12 | 10.12 | 10.12 |
| Capital Expenditure | -109.4 | -170.9 | -186.0 | -495.8 | -836.1 | -494.1 | -580.5 | -682.0 | -801.3 | -941.5 |
| Capital Expenditure, % | -3.24 | -3.89 | -3.58 | -9.24 | -13.17 | -6.63 | -6.63 | -6.63 | -6.63 | -6.63 |
| Tax Rate, % | 15.38 | 15.38 | 15.38 | 15.38 | 15.38 | 15.38 | 15.38 | 15.38 | 15.38 | 15.38 |
| EBITAT | 207.5 | 169.3 | 303.9 | 407.7 | 384.0 | 436.9 | 513.4 | 603.1 | 708.7 | 832.6 |
| Depreciation | ||||||||||
| Changes in Account Receivables | ||||||||||
| Changes in Inventories | ||||||||||
| Changes in Accounts Payable | ||||||||||
| Capital Expenditure | ||||||||||
| UFCF | -1,216.1 | -728.2 | -36.1 | 141.3 | -1,154.3 | -246.6 | -507.9 | -596.8 | -701.1 | -823.8 |
| WACC, % | 7.64 | 7.59 | 7.66 | 7.66 | 7.65 | 7.64 | 7.64 | 7.64 | 7.64 | 7.64 |
| PV UFCF | ||||||||||
| SUM PV UFCF | -2,238.2 | |||||||||
| Long Term Growth Rate, % | 1.00 | |||||||||
| Free cash flow (T + 1) | -832 | |||||||||
| Terminal Value | -12,527 | |||||||||
| Present Terminal Value | -8,668 | |||||||||
| Enterprise Value | -10,906 | |||||||||
| Net Debt | 1,429 | |||||||||
| Equity Value | -12,335 | |||||||||
| Diluted Shares Outstanding, MM | 511 | |||||||||
| Equity Value Per Share | -24.15 |
What You Will Receive
- Genuine 605196SS Financial Data: Access to both historical and projected figures for precise valuation.
- Customizable Inputs: Adjust key metrics like WACC, tax rates, revenue growth, and capital expenditure.
- Automatic Computations: Intrinsic value and NPV are computed in real-time.
- Scenario Analysis: Evaluate various scenarios to assess the future performance of Hebei Huatong Wires and Cables Group Co., Ltd.
- User-Friendly Interface: Designed for industry professionals, yet easy for newcomers to navigate.
Key Features
- 🔍 Real-Life [605196SS] Financials: Pre-filled historical and projected data for Hebei Huatong Wires and Cables Group Co., Ltd.
- ✏️ Fully Customizable Inputs: Modify all essential parameters (yellow cells) such as WACC, growth %, and tax rates.
- 📊 Professional DCF Valuation: Integrated formulas determine the intrinsic value of Hebei Huatong using the Discounted Cash Flow method.
- ⚡ Instant Results: See Hebei Huatong's valuation in real-time after making modifications.
- Scenario Analysis: Evaluate and compare different financial assumptions side-by-side.
How It Works
- Step 1: Download the Excel file for Hebei Huatong Wires and Cables Group Co., Ltd. (605196SS).
- Step 2: Review the pre-filled financial data and forecasts specific to Hebei Huatong.
- Step 3: Adjust key inputs such as revenue growth, WACC, and tax rates (highlighted cells).
- Step 4: Observe the DCF model update in real-time as you modify your assumptions.
- Step 5: Analyze the results and leverage the findings for your investment strategies.
Why Choose This Calculator?
- User-Friendly Interface: Perfectly designed for both novices and seasoned professionals.
- Customizable Parameters: Adjust inputs effortlessly to suit your analytical needs.
- Real-Time Feedback: Observe immediate updates on Hebei Huatong Wires and Cables Group Co., Ltd.'s valuation as you tweak the inputs.
- Preconfigured Data: Comes preloaded with actual financial metrics for quick assessments of Hebei Huatong Wires and Cables Group Co., Ltd. (605196SS).
- Endorsed by Experts: Widely used by investors and analysts to facilitate smart decision-making.
Who Can Benefit from This Product?
- Institutional Investors: Create comprehensive and accurate valuation models for portfolio evaluation.
- Corporate Finance Departments: Assess valuation scenarios to inform strategic business decisions.
- Financial Consultants and Advisors: Deliver precise valuation insights for Hebei Huatong Wires and Cables Group Co., Ltd. (605196SS).
- Students and Educators: Utilize real-world data to enhance financial modeling practices and education.
- Industry Analysts: Gain insights into how companies like Hebei Huatong are valued within the wire and cable manufacturing sector.
Contents of the Template
- Historical Data: Contains Hebei Huatong Wires and Cables Group Co., Ltd.’s past financial performance and baseline projections.
- DCF and Levered DCF Models: Comprehensive templates for assessing the intrinsic value of Hebei Huatong [605196SS].
- WACC Sheet: Pre-calculated figures for the Weighted Average Cost of Capital.
- Editable Inputs: Adjust key variables such as growth rates, EBITDA percentages, and CAPEX assumptions.
- Quarterly and Annual Statements: A thorough analysis of Hebei Huatong’s financial statements.
- Interactive Dashboard: Dynamic visualization of valuation results and future projections.
Disclaimer
All information, articles, and product details provided on this website are for general informational and educational purposes only. We do not claim any ownership over, nor do we intend to infringe upon, any trademarks, copyrights, logos, brand names, or other intellectual property mentioned or depicted on this site. Such intellectual property remains the property of its respective owners, and any references here are made solely for identification or informational purposes, without implying any affiliation, endorsement, or partnership.
We make no representations or warranties, express or implied, regarding the accuracy, completeness, or suitability of any content or products presented. Nothing on this website should be construed as legal, tax, investment, financial, medical, or other professional advice. In addition, no part of this site—including articles or product references—constitutes a solicitation, recommendation, endorsement, advertisement, or offer to buy or sell any securities, franchises, or other financial instruments, particularly in jurisdictions where such activity would be unlawful.
All content is of a general nature and may not address the specific circumstances of any individual or entity. It is not a substitute for professional advice or services. Any actions you take based on the information provided here are strictly at your own risk. You accept full responsibility for any decisions or outcomes arising from your use of this website and agree to release us from any liability in connection with your use of, or reliance upon, the content or products found herein.