
|
Namchow Food Group Co., Ltd. (605339.Ss) Avaliação DCF |
Totalmente Editável: Adapte-Se Às Suas Necessidades No Excel Ou Planilhas
Design Profissional: Modelos Confiáveis E Padrão Da Indústria
Pré-Construídos Para Uso Rápido E Eficiente
Compatível com MAC/PC, totalmente desbloqueado
Não É Necessária Experiência; Fácil De Seguir
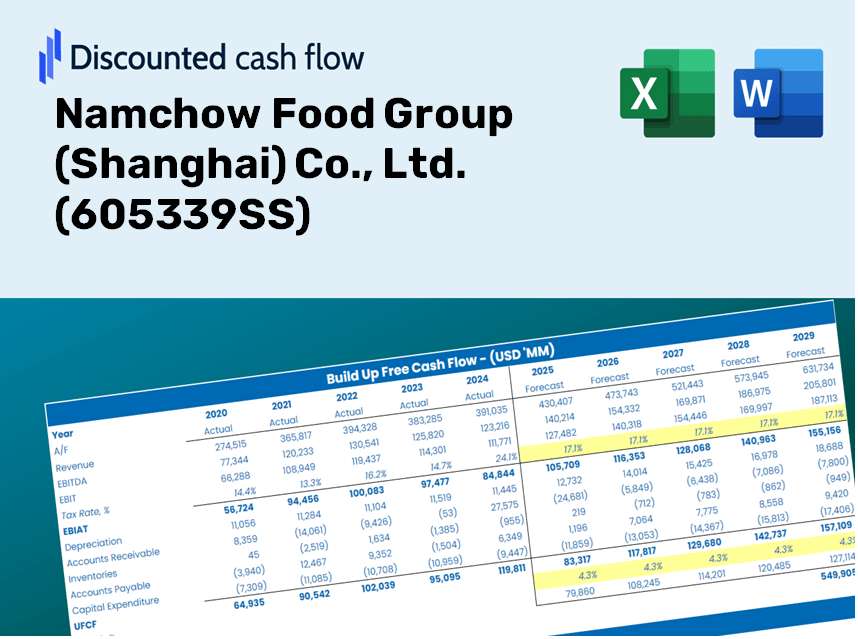
Namchow Food Group (Shanghai) Co., Ltd. (605339.SS) Bundle
Avalie o Namchow Food Group (Shanghai) Co., Ltd. (605339Ss) perspectivas financeiras como um especialista! Esta calculadora (605339SS) DCF fornece finanças pré-preenchidas e flexibilidade para modificar o crescimento da receita, o WACC, as margens e outras suposições essenciais para se alinhar às suas previsões.
Discounted Cash Flow (DCF) - (USD MM)
| Year | AY1 2020 |
AY2 2021 |
AY3 2022 |
AY4 2023 |
AY5 2024 |
FY1 2025 |
FY2 2026 |
FY3 2027 |
FY4 2028 |
FY5 2029 |
|---|---|---|---|---|---|---|---|---|---|---|
| Revenue | 2,322.4 | 2,873.0 | 2,861.4 | 3,082.5 | 3,159.3 | 3,424.1 | 3,711.1 | 4,022.1 | 4,359.2 | 4,724.6 |
| Revenue Growth, % | 0 | 23.71 | -0.40366 | 7.73 | 2.49 | 8.38 | 8.38 | 8.38 | 8.38 | 8.38 |
| EBITDA | 482.1 | 519.7 | 238.2 | 311.8 | 279.4 | 452.9 | 490.8 | 532.0 | 576.6 | 624.9 |
| EBITDA, % | 20.76 | 18.09 | 8.33 | 10.11 | 8.84 | 13.23 | 13.23 | 13.23 | 13.23 | 13.23 |
| Depreciation | 95.1 | 99.6 | 94.2 | 98.7 | 102.6 | 118.5 | 128.4 | 139.2 | 150.9 | 163.5 |
| Depreciation, % | 4.1 | 3.47 | 3.29 | 3.2 | 3.25 | 3.46 | 3.46 | 3.46 | 3.46 | 3.46 |
| EBIT | 386.9 | 420.1 | 144.0 | 213.0 | 176.9 | 334.4 | 362.4 | 392.8 | 425.7 | 461.4 |
| EBIT, % | 16.66 | 14.62 | 5.03 | 6.91 | 5.6 | 9.76 | 9.76 | 9.76 | 9.76 | 9.76 |
| Total Cash | 1,130.6 | 2,038.0 | 2,084.9 | 1,704.1 | 1,331.3 | 1,985.3 | 2,151.7 | 2,332.1 | 2,527.5 | 2,739.4 |
| Total Cash, percent | .0 | .0 | .0 | .0 | .0 | .0 | .0 | .0 | .0 | .0 |
| Account Receivables | 166.7 | 221.6 | 204.4 | 181.4 | 196.8 | 233.9 | 253.5 | 274.7 | 297.7 | 322.7 |
| Account Receivables, % | 7.18 | 7.71 | 7.14 | 5.89 | 6.23 | 6.83 | 6.83 | 6.83 | 6.83 | 6.83 |
| Inventories | 351.0 | 555.9 | 570.1 | 497.5 | 653.2 | 624.5 | 676.9 | 733.6 | 795.1 | 861.7 |
| Inventories, % | 15.11 | 19.35 | 19.92 | 16.14 | 20.67 | 18.24 | 18.24 | 18.24 | 18.24 | 18.24 |
| Accounts Payable | 170.0 | 220.6 | 203.8 | 176.1 | 252.2 | 245.3 | 265.9 | 288.2 | 312.3 | 338.5 |
| Accounts Payable, % | 7.32 | 7.68 | 7.12 | 5.71 | 7.98 | 7.16 | 7.16 | 7.16 | 7.16 | 7.16 |
| Capital Expenditure | -75.0 | -109.6 | -112.0 | -180.1 | -208.5 | -160.3 | -173.7 | -188.3 | -204.0 | -221.2 |
| Capital Expenditure, % | -3.23 | -3.82 | -3.92 | -5.84 | -6.6 | -4.68 | -4.68 | -4.68 | -4.68 | -4.68 |
| Tax Rate, % | 15.71 | 15.71 | 15.71 | 15.71 | 15.71 | 15.71 | 15.71 | 15.71 | 15.71 | 15.71 |
| EBITAT | 308.6 | 336.9 | 118.0 | 182.1 | 149.1 | 275.3 | 298.4 | 323.4 | 350.5 | 379.9 |
| Depreciation | ||||||||||
| Changes in Account Receivables | ||||||||||
| Changes in Inventories | ||||||||||
| Changes in Accounts Payable | ||||||||||
| Capital Expenditure | ||||||||||
| UFCF | -18.8 | 117.5 | 86.5 | 168.6 | -51.8 | 218.2 | 201.7 | 218.6 | 237.0 | 256.8 |
| WACC, % | 6.28 | 6.28 | 6.28 | 6.29 | 6.28 | 6.28 | 6.28 | 6.28 | 6.28 | 6.28 |
| PV UFCF | ||||||||||
| SUM PV UFCF | 941.1 | |||||||||
| Long Term Growth Rate, % | 2.00 | |||||||||
| Free cash flow (T + 1) | 262 | |||||||||
| Terminal Value | 6,117 | |||||||||
| Present Terminal Value | 4,511 | |||||||||
| Enterprise Value | 5,452 | |||||||||
| Net Debt | -1,036 | |||||||||
| Equity Value | 6,488 | |||||||||
| Diluted Shares Outstanding, MM | 422 | |||||||||
| Equity Value Per Share | 15.39 |
What You Will Receive
- Authentic Namchow Data: Preloaded financial metrics – including revenue and EBIT – derived from actual and forecasted figures.
- Comprehensive Customization: Modify all essential parameters (yellow cells) such as WACC, growth %, and tax rates.
- Real-Time Valuation Adjustments: Automatic recalculations to assess the effects of changes on Namchow's fair value.
- Flexible Excel Template: Designed for easy edits, scenario simulations, and thorough projections.
- Efficient and Precise: Avoid the hassle of constructing models from scratch while ensuring accuracy and adaptability.
Key Features
- 🔍 Real-Life Namchow Financials: Pre-filled historical and projected data for Namchow Food Group (Shanghai) Co., Ltd. (605339SS).
- ✏️ Fully Customizable Inputs: Adjust all critical parameters (yellow cells) such as WACC, growth %, and tax rates.
- 📊 Professional DCF Valuation: Integrated formulas calculate Namchow's intrinsic value using the Discounted Cash Flow approach.
- ⚡ Instant Results: Visualize Namchow's valuation instantly after making adjustments.
- Scenario Analysis: Evaluate and compare results for different financial assumptions side-by-side.
How It Functions
- 1. Access the Template: Download and open the Excel file containing Namchow Food Group's (605339SS) preloaded financial data.
- 2. Modify Assumptions: Adjust critical inputs such as growth rates, weighted average cost of capital (WACC), and capital expenditures.
- 3. Observe Immediate Results: The DCF model automatically computes intrinsic value and net present value (NPV).
- 4. Evaluate Scenarios: Analyze various forecasts to examine different valuation possibilities.
- 5. Present with Assurance: Share professional valuation insights to strengthen your decision-making process.
Why Select This Calculator for Namchow Food Group (Shanghai) Co., Ltd. (605339SS)?
- Accurate Financial Insights: Utilize reliable financial data specific to Namchow Food Group for trustworthy valuation outcomes.
- Tailored Features: Modify essential inputs like growth projections, WACC, and tax rates to align with your expectations.
- Efficiency Boost: Pre-configured calculations save you the effort of building from the ground up.
- Professional Quality: Crafted for investors, analysts, and consultants focused on Namchow Food Group.
- Accessible Interface: User-friendly design and clear, step-by-step guidance cater to users of all experience levels.
Who Should Use This Product?
- Individual Investors: Make informed decisions about buying or selling Namchow Food Group (Shanghai) Co., Ltd. (605339SS) stock.
- Financial Analysts: Enhance valuation processes with readily available financial models specific to Namchow.
- Consultants: Provide clients with expert valuation insights about Namchow Food Group swiftly and accurately.
- Business Owners: Gain insights into how large corporations like Namchow are valued to inform your own business strategies.
- Finance Students: Master valuation techniques using real data and scenarios from Namchow Food Group (Shanghai) Co., Ltd. (605339SS).
Contents of the Template
- Pre-Populated Data: Features Namchow Food Group's historical financial figures and projections.
- Discounted Cash Flow Model: An editable DCF valuation model with automatic calculations included.
- Weighted Average Cost of Capital (WACC): A dedicated worksheet for determining WACC based on user-defined inputs.
- Key Financial Ratios: Evaluate Namchow Food Group's profitability, efficiency, and financial leverage.
- Customizable Inputs: Easily modify revenue growth, margins, and tax rates.
- User-Friendly Dashboard: Visual representations including charts and tables summarizing essential valuation outcomes.
Disclaimer
All information, articles, and product details provided on this website are for general informational and educational purposes only. We do not claim any ownership over, nor do we intend to infringe upon, any trademarks, copyrights, logos, brand names, or other intellectual property mentioned or depicted on this site. Such intellectual property remains the property of its respective owners, and any references here are made solely for identification or informational purposes, without implying any affiliation, endorsement, or partnership.
We make no representations or warranties, express or implied, regarding the accuracy, completeness, or suitability of any content or products presented. Nothing on this website should be construed as legal, tax, investment, financial, medical, or other professional advice. In addition, no part of this site—including articles or product references—constitutes a solicitation, recommendation, endorsement, advertisement, or offer to buy or sell any securities, franchises, or other financial instruments, particularly in jurisdictions where such activity would be unlawful.
All content is of a general nature and may not address the specific circumstances of any individual or entity. It is not a substitute for professional advice or services. Any actions you take based on the information provided here are strictly at your own risk. You accept full responsibility for any decisions or outcomes arising from your use of this website and agree to release us from any liability in connection with your use of, or reliance upon, the content or products found herein.