
|
China Merchants Securities Co., Ltd. (6099.HK) Avaliação DCF |
Totalmente Editável: Adapte-Se Às Suas Necessidades No Excel Ou Planilhas
Design Profissional: Modelos Confiáveis E Padrão Da Indústria
Pré-Construídos Para Uso Rápido E Eficiente
Compatível com MAC/PC, totalmente desbloqueado
Não É Necessária Experiência; Fácil De Seguir
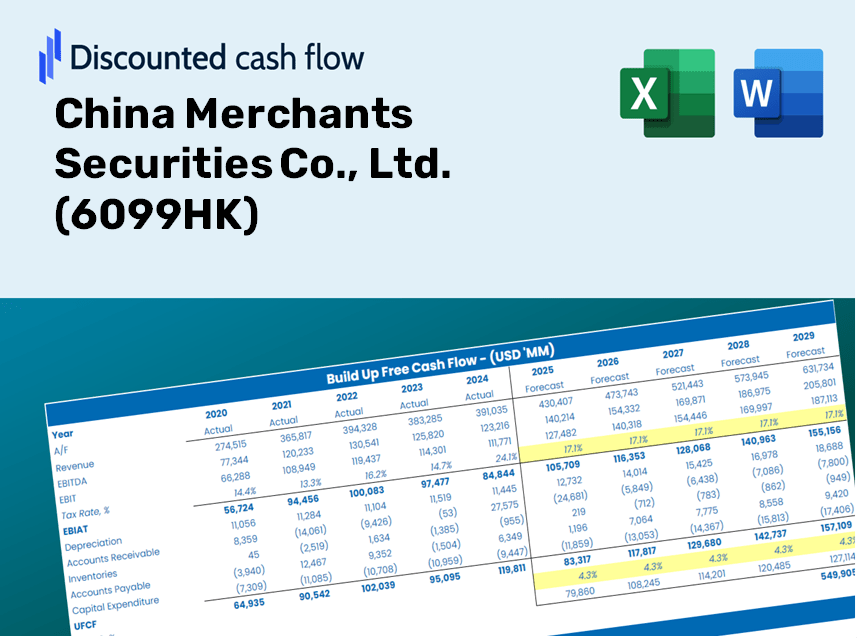
China Merchants Securities Co., Ltd. (6099.HK) Bundle
Revele o verdadeiro potencial da China Merchants Securities Co., Ltd. (6099HK) com nossa calculadora DCF avançada! Ajuste as principais suposições, explore vários cenários e avalie como as modificações afetam a avaliação da China Merchants Securities Co., Ltd. (6099HK) - tudo dentro de um único modelo do Excel.
Discounted Cash Flow (DCF) - (USD MM)
| Year | AY1 2020 |
AY2 2021 |
AY3 2022 |
AY4 2023 |
AY5 2024 |
FY1 2025 |
FY2 2026 |
FY3 2027 |
FY4 2028 |
FY5 2029 |
|---|---|---|---|---|---|---|---|---|---|---|
| Revenue | 25,363.0 | 40,910.6 | 29,346.2 | 19,956.5 | 21,179.8 | 21,559.3 | 21,945.6 | 22,338.8 | 22,739.0 | 23,146.5 |
| Revenue Growth, % | 0 | 61.3 | -28.27 | -32 | 6.13 | 1.79 | 1.79 | 1.79 | 1.79 | 1.79 |
| EBITDA | .0 | 15,529.5 | .0 | .0 | .0 | 1,636.8 | 1,666.1 | 1,695.9 | 1,726.3 | 1,757.3 |
| EBITDA, % | 0 | 37.96 | 0 | 0 | 0 | 7.59 | 7.59 | 7.59 | 7.59 | 7.59 |
| Depreciation | 525.0 | 570.6 | 588.1 | 633.9 | 754.0 | 526.3 | 535.7 | 545.3 | 555.1 | 565.0 |
| Depreciation, % | 2.07 | 1.39 | 2 | 3.18 | 3.56 | 2.44 | 2.44 | 2.44 | 2.44 | 2.44 |
| EBIT | -525.0 | 14,958.9 | -588.1 | -633.9 | -754.0 | 1,110.5 | 1,130.4 | 1,150.6 | 1,171.3 | 1,192.2 |
| EBIT, % | -2.07 | 36.56 | -2 | -3.18 | -3.56 | 5.15 | 5.15 | 5.15 | 5.15 | 5.15 |
| Total Cash | 214,157.3 | 246,304.9 | 252,086.6 | 266,703.9 | 312,456.0 | 21,559.3 | 21,945.6 | 22,338.8 | 22,739.0 | 23,146.5 |
| Total Cash, percent | .0 | .0 | .0 | .0 | .0 | .0 | .0 | .0 | .0 | .0 |
| Account Receivables | 1,095.6 | 1,152.2 | 1,047.3 | 724.4 | 745.8 | 769.9 | 783.7 | 797.7 | 812.0 | 826.6 |
| Account Receivables, % | 4.32 | 2.82 | 3.57 | 3.63 | 3.52 | 3.57 | 3.57 | 3.57 | 3.57 | 3.57 |
| Inventories | .0 | .0 | .0 | .0 | .0 | .0 | .0 | .0 | .0 | .0 |
| Inventories, % | 0 | 0 | 0 | 0 | 0 | 0 | 0 | 0 | 0 | 0 |
| Accounts Payable | 16,115.4 | 31,695.5 | 27,404.7 | 41,572.7 | 27,317.2 | 18,730.7 | 19,066.3 | 19,407.9 | 19,755.6 | 20,109.6 |
| Accounts Payable, % | 63.54 | 77.48 | 93.38 | 208.32 | 128.98 | 86.88 | 86.88 | 86.88 | 86.88 | 86.88 |
| Capital Expenditure | -407.9 | -450.6 | -611.6 | -663.9 | -833.7 | -519.9 | -529.2 | -538.7 | -548.3 | -558.1 |
| Capital Expenditure, % | -1.61 | -1.1 | -2.08 | -3.33 | -3.94 | -2.41 | -2.41 | -2.41 | -2.41 | -2.41 |
| Tax Rate, % | 7.43 | 7.43 | 7.43 | 7.43 | 7.43 | 7.43 | 7.43 | 7.43 | 7.43 | 7.43 |
| EBITAT | -440.6 | 12,711.6 | -556.3 | -597.7 | -698.0 | 1,000.2 | 1,018.1 | 1,036.4 | 1,055.0 | 1,073.9 |
| Depreciation | ||||||||||
| Changes in Account Receivables | ||||||||||
| Changes in Inventories | ||||||||||
| Changes in Accounts Payable | ||||||||||
| Capital Expenditure | ||||||||||
| UFCF | 14,696.3 | 28,355.1 | -4,765.6 | 13,863.2 | -15,054.6 | -7,604.0 | 1,346.5 | 1,370.6 | 1,395.1 | 1,420.1 |
| WACC, % | 6.51 | 6.54 | 6.9 | 6.89 | 6.82 | 6.73 | 6.73 | 6.73 | 6.73 | 6.73 |
| PV UFCF | ||||||||||
| SUM PV UFCF | -2,714.8 | |||||||||
| Long Term Growth Rate, % | 2.00 | |||||||||
| Free cash flow (T + 1) | 1,449 | |||||||||
| Terminal Value | 30,610 | |||||||||
| Present Terminal Value | 22,100 | |||||||||
| Enterprise Value | 19,385 | |||||||||
| Net Debt | 108,469 | |||||||||
| Equity Value | -89,084 | |||||||||
| Diluted Shares Outstanding, MM | 8,697 | |||||||||
| Equity Value Per Share | -10.24 |
What You Will Receive
- Authentic 6099HK Financial Data: Comprehensive historical and projected figures for precise assessment.
- Customizable Parameters: Adjust WACC, tax rates, revenue growth, and capital expenditures as needed.
- Automatic Valuation: Intrinsic value and NPV calculations are performed in real-time.
- Scenario Simulation: Explore various scenarios to analyze the future outlook of China Merchants Securities.
- User-Friendly Interface: Designed for experts while remaining approachable for newcomers.
Key Features
- Real-Time 6099HK Data: Pre-loaded with historical financials and future projections for China Merchants Securities Co., Ltd.
- Comprehensive Customization: Tailor inputs for revenue growth, profit margins, WACC, tax rates, and capital expenditures.
- Dynamic Valuation Model: Instant updates to Net Present Value (NPV) and intrinsic value based on your customized inputs.
- Scenario Analysis: Develop various forecasting scenarios to evaluate different valuation possibilities.
- User-Friendly Interface: Intuitive layout designed for both seasoned professionals and newcomers.
How It Works
- Step 1: Download the prebuilt Excel template containing data for China Merchants Securities Co., Ltd. (6099HK).
- Step 2: Review the pre-filled sheets to familiarize yourself with the essential metrics.
- Step 3: Adjust forecasts and assumptions in the editable yellow cells (WACC, growth, margins).
- Step 4: Instantly access recalculated results, including the intrinsic value of China Merchants Securities Co., Ltd. (6099HK).
- Step 5: Utilize the outputs to make well-informed investment decisions or to create detailed reports.
Why Opt for This Calculator?
- User-Friendly Interface: Perfectly crafted for both newcomers and seasoned professionals.
- Customizable Inputs: Effortlessly adjust parameters to tailor your analysis.
- Real-Time Updates: Observe immediate changes to China Merchants Securities Co., Ltd. (6099HK) valuation as you tweak inputs.
- Pre-Loaded Data: Comes with China Merchants Securities Co., Ltd.’s (6099HK) actual financial figures for swift assessments.
- Relied Upon by Experts: Utilized by investors and analysts for well-informed decision-making.
Who Should Use This Product?
- Institutional Investors: Create comprehensive and trustworthy valuation models for analyzing portfolios involving China Merchants Securities Co., Ltd. (6099HK).
- Corporate Finance Departments: Evaluate valuation scenarios to inform strategic decisions within the organization.
- Financial Consultants and Advisors: Deliver precise valuation insights related to China Merchants Securities Co., Ltd. (6099HK) for clients.
- Students and Instructors: Utilize real-time data to enhance learning and practice in financial modeling.
- Market Analysts: Gain insights into how financial firms like China Merchants Securities Co., Ltd. (6099HK) are valued in the marketplace.
Contents of the Template
- Pre-Filled DCF Model: China Merchants Securities Co., Ltd.’s (6099HK) financial data preloaded for immediate utilization.
- WACC Calculator: Comprehensive calculations for the Weighted Average Cost of Capital.
- Financial Ratios: Analyze China Merchants Securities Co., Ltd.’s (6099HK) profitability, leverage, and efficiency.
- Editable Inputs: Modify assumptions such as growth rates, profit margins, and capital expenditures to suit your scenarios.
- Financial Statements: Annual and quarterly reports to facilitate in-depth analysis.
- Interactive Dashboard: Effortlessly visualize key valuation metrics and outcomes.
Disclaimer
All information, articles, and product details provided on this website are for general informational and educational purposes only. We do not claim any ownership over, nor do we intend to infringe upon, any trademarks, copyrights, logos, brand names, or other intellectual property mentioned or depicted on this site. Such intellectual property remains the property of its respective owners, and any references here are made solely for identification or informational purposes, without implying any affiliation, endorsement, or partnership.
We make no representations or warranties, express or implied, regarding the accuracy, completeness, or suitability of any content or products presented. Nothing on this website should be construed as legal, tax, investment, financial, medical, or other professional advice. In addition, no part of this site—including articles or product references—constitutes a solicitation, recommendation, endorsement, advertisement, or offer to buy or sell any securities, franchises, or other financial instruments, particularly in jurisdictions where such activity would be unlawful.
All content is of a general nature and may not address the specific circumstances of any individual or entity. It is not a substitute for professional advice or services. Any actions you take based on the information provided here are strictly at your own risk. You accept full responsibility for any decisions or outcomes arising from your use of this website and agree to release us from any liability in connection with your use of, or reliance upon, the content or products found herein.