
|
Avaliação DCF da OSG Corporation (6136.T) |
Totalmente Editável: Adapte-Se Às Suas Necessidades No Excel Ou Planilhas
Design Profissional: Modelos Confiáveis E Padrão Da Indústria
Pré-Construídos Para Uso Rápido E Eficiente
Compatível com MAC/PC, totalmente desbloqueado
Não É Necessária Experiência; Fácil De Seguir
OSG Corporation (6136.T) Bundle
Aprimore suas estratégias de investimento com a calculadora DCF da OSG Corporation (6136T)! Utilize dados financeiros reais do OSG, ajuste as projeções e despesas de crescimento e observe instantaneamente como essas modificações afetam o valor intrínseco da OSG Corporation (6136T).
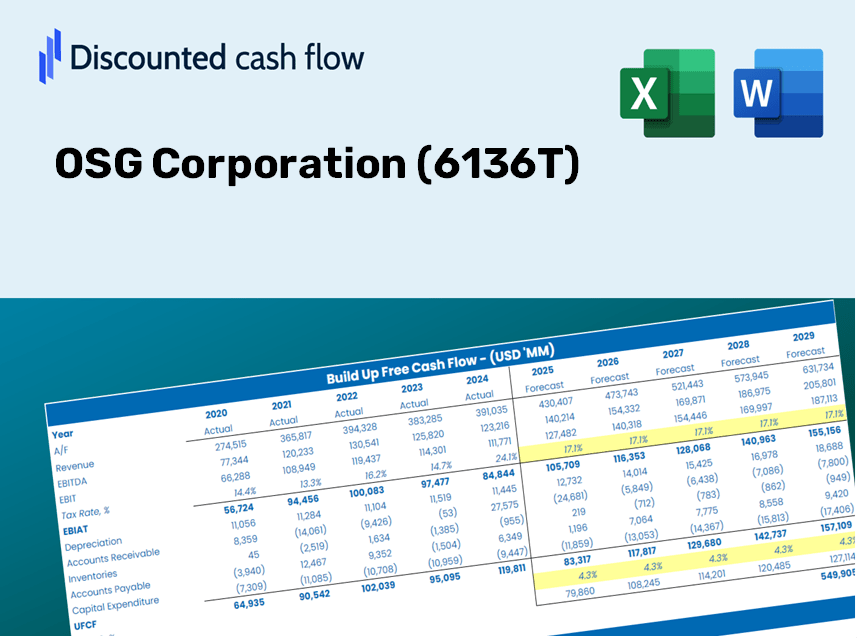
Discounted Cash Flow (DCF) - (USD MM)
| Year | AY1 2020 |
AY2 2021 |
AY3 2022 |
AY4 2023 |
AY5 2024 |
FY1 2025 |
FY2 2026 |
FY3 2027 |
FY4 2028 |
FY5 2029 |
|---|---|---|---|---|---|---|---|---|---|---|
| Revenue | 104,388.0 | 126,156.0 | 142,525.0 | 147,703.0 | 155,517.0 | 172,138.5 | 190,536.5 | 210,900.8 | 233,441.6 | 258,391.6 |
| Revenue Growth, % | 0 | 20.85 | 12.98 | 3.63 | 5.29 | 10.69 | 10.69 | 10.69 | 10.69 | 10.69 |
| EBITDA | 20,312.0 | 27,995.0 | 35,042.0 | 31,741.0 | 32,907.0 | 37,486.6 | 41,493.1 | 45,927.9 | 50,836.6 | 56,270.0 |
| EBITDA, % | 19.46 | 22.19 | 24.59 | 21.49 | 21.16 | 21.78 | 21.78 | 21.78 | 21.78 | 21.78 |
| Depreciation | 11,173.0 | 11,386.0 | 11,379.0 | 11,940.0 | 12,829.0 | 15,163.9 | 16,784.6 | 18,578.5 | 20,564.1 | 22,762.0 |
| Depreciation, % | 10.7 | 9.03 | 7.98 | 8.08 | 8.25 | 8.81 | 8.81 | 8.81 | 8.81 | 8.81 |
| EBIT | 9,139.0 | 16,609.0 | 23,663.0 | 19,801.0 | 20,078.0 | 22,322.7 | 24,708.6 | 27,349.4 | 30,272.4 | 33,507.9 |
| EBIT, % | 8.75 | 13.17 | 16.6 | 13.41 | 12.91 | 12.97 | 12.97 | 12.97 | 12.97 | 12.97 |
| Total Cash | 37,807.0 | 46,896.0 | 46,697.0 | 57,971.0 | 55,878.0 | 62,429.0 | 69,101.4 | 76,486.8 | 84,661.7 | 93,710.2 |
| Total Cash, percent | .0 | .0 | .0 | .0 | .0 | .0 | .0 | .0 | .0 | .0 |
| Account Receivables | 19,578.0 | 23,352.0 | 26,511.0 | 28,448.0 | 28,244.0 | 32,116.9 | 35,549.5 | 39,349.0 | 43,554.6 | 48,209.7 |
| Account Receivables, % | 18.76 | 18.51 | 18.6 | 19.26 | 18.16 | 18.66 | 18.66 | 18.66 | 18.66 | 18.66 |
| Inventories | 42,024.0 | 42,837.0 | 52,025.0 | 56,493.0 | 56,001.0 | 63,681.8 | 70,488.1 | 78,021.8 | 86,360.7 | 95,590.8 |
| Inventories, % | 40.26 | 33.96 | 36.5 | 38.25 | 36.01 | 36.99 | 36.99 | 36.99 | 36.99 | 36.99 |
| Accounts Payable | 4,308.0 | 5,244.0 | 5,887.0 | 6,019.0 | 5,792.0 | 6,959.1 | 7,702.9 | 8,526.1 | 9,437.4 | 10,446.0 |
| Accounts Payable, % | 4.13 | 4.16 | 4.13 | 4.08 | 3.72 | 4.04 | 4.04 | 4.04 | 4.04 | 4.04 |
| Capital Expenditure | -10,117.0 | -5,790.0 | -8,864.0 | -11,158.0 | -16,192.0 | -13,243.2 | -14,658.6 | -16,225.3 | -17,959.4 | -19,878.9 |
| Capital Expenditure, % | -9.69 | -4.59 | -6.22 | -7.55 | -10.41 | -7.69 | -7.69 | -7.69 | -7.69 | -7.69 |
| Tax Rate, % | 32.14 | 32.14 | 32.14 | 32.14 | 32.14 | 32.14 | 32.14 | 32.14 | 32.14 | 32.14 |
| EBITAT | 5,793.0 | 11,160.3 | 16,735.6 | 13,654.6 | 13,625.6 | 15,096.0 | 16,709.4 | 18,495.3 | 20,472.0 | 22,660.1 |
| Depreciation | ||||||||||
| Changes in Account Receivables | ||||||||||
| Changes in Inventories | ||||||||||
| Changes in Accounts Payable | ||||||||||
| Capital Expenditure | ||||||||||
| UFCF | -50,445.0 | 13,105.3 | 7,546.6 | 8,163.6 | 10,731.6 | 6,630.0 | 9,340.3 | 10,338.6 | 11,443.6 | 12,666.6 |
| WACC, % | 6.55 | 6.57 | 6.6 | 6.59 | 6.58 | 6.58 | 6.58 | 6.58 | 6.58 | 6.58 |
| PV UFCF | ||||||||||
| SUM PV UFCF | 41,065.4 | |||||||||
| Long Term Growth Rate, % | 2.00 | |||||||||
| Free cash flow (T + 1) | 12,920 | |||||||||
| Terminal Value | 282,267 | |||||||||
| Present Terminal Value | 205,276 | |||||||||
| Enterprise Value | 246,342 | |||||||||
| Net Debt | -6,677 | |||||||||
| Equity Value | 253,019 | |||||||||
| Diluted Shares Outstanding, MM | 100 | |||||||||
| Equity Value Per Share | 2,522.28 |
What You'll Receive
- Genuine OSG Corporation Data: Comprehensive financials – encompassing revenue to EBIT – derived from actual and forecasted figures.
- Complete Customization: Modify all key parameters (yellow cells) such as WACC, growth %, and tax rates.
- Immediate Valuation Updates: Automatic recalculations to assess the impact of changes on the fair value of OSG Corporation (6136T).
- Flexible Excel Template: Designed for quick modifications, scenario analysis, and extensive projections.
- Efficient and Precise: Avoid starting models from scratch while ensuring accuracy and adaptability.
Key Features
- Comprehensive OSG Financials: Gain access to precise historical data and future forecasts tailored for OSG Corporation (6136T).
- Flexible Forecast Inputs: Modify highlighted fields such as WACC, growth rates, and profit margins to suit your analysis.
- Real-Time Calculations: Enjoy automatic updates for DCF, Net Present Value (NPV), and cash flow assessments.
- Interactive Dashboard: Benefit from user-friendly charts and summaries that clearly present your valuation findings.
- Designed for All Levels: An intuitive layout catered to investors, CFOs, and consultants, regardless of expertise.
How It Operates
- 1. Download the Template: Get the Excel file featuring OSG Corporation's (6136T) preloaded data.
- 2. Modify Inputs: Adjust essential parameters such as growth rates, WACC, and capital expenditures.
- 3. Access Results Instantly: The DCF model automatically calculates the intrinsic value and NPV.
- 4. Explore Scenarios: Evaluate various forecasts to assess different valuation results.
- 5. Present with Assurance: Share professional valuation analysis to inform your decisions.
Why Opt for This Calculator?
- Precise Data: Access to actual OSG Corporation (6136T) financials guarantees trustworthy valuation outcomes.
- Tailorable: Modify essential variables such as growth rates, WACC, and tax rates to align with your forecasts.
- Efficiency Boost: Ready-made calculations save you the hassle of starting from square one.
- Professional-Quality Tool: Crafted for investors, analysts, and consultants alike.
- Easy to Use: User-friendly design and clear guidance ensure accessibility for everyone.
Who Can Benefit from OSG Corporation (6136T)?
- Finance Students: Master valuation techniques and practice with real-world data.
- Researchers: Include advanced financial models in your academic projects or studies.
- Investors: Evaluate your investment theories and assess valuation metrics for OSG Corporation (6136T).
- Financial Analysts: Enhance your efficiency with a flexible, pre-designed DCF model.
- Entrepreneurs: Discover how major public companies like OSG Corporation (6136T) are evaluated.
Contents of the Template
- Historical Data: Contains OSG Corporation's past financial performance and foundational forecasts.
- DCF and Levered DCF Models: Comprehensive templates for assessing OSG Corporation's intrinsic value.
- WACC Sheet: Automatically generated calculations for the Weighted Average Cost of Capital.
- Editable Inputs: Adjust critical factors such as growth rates, EBITDA percentages, and CAPEX projections.
- Quarterly and Annual Statements: Detailed insights into OSG Corporation's financial data.
- Interactive Dashboard: Dynamically visualize valuation outcomes and future projections.
Disclaimer
All information, articles, and product details provided on this website are for general informational and educational purposes only. We do not claim any ownership over, nor do we intend to infringe upon, any trademarks, copyrights, logos, brand names, or other intellectual property mentioned or depicted on this site. Such intellectual property remains the property of its respective owners, and any references here are made solely for identification or informational purposes, without implying any affiliation, endorsement, or partnership.
We make no representations or warranties, express or implied, regarding the accuracy, completeness, or suitability of any content or products presented. Nothing on this website should be construed as legal, tax, investment, financial, medical, or other professional advice. In addition, no part of this site—including articles or product references—constitutes a solicitation, recommendation, endorsement, advertisement, or offer to buy or sell any securities, franchises, or other financial instruments, particularly in jurisdictions where such activity would be unlawful.
All content is of a general nature and may not address the specific circumstances of any individual or entity. It is not a substitute for professional advice or services. Any actions you take based on the information provided here are strictly at your own risk. You accept full responsibility for any decisions or outcomes arising from your use of this website and agree to release us from any liability in connection with your use of, or reliance upon, the content or products found herein.