
|
EBARA CORPORATION (6361.T) Avaliação DCF |
Totalmente Editável: Adapte-Se Às Suas Necessidades No Excel Ou Planilhas
Design Profissional: Modelos Confiáveis E Padrão Da Indústria
Pré-Construídos Para Uso Rápido E Eficiente
Compatível com MAC/PC, totalmente desbloqueado
Não É Necessária Experiência; Fácil De Seguir
Ebara Corporation (6361.T) Bundle
Avalie as perspectivas financeiras da Ebara Corporation com experiência! Esta calculadora (6361T) DCF fornece dados financeiros pré-preenchidos e permite personalizar o crescimento da receita, WACC, margens e outras suposições essenciais para se alinhar às suas projeções.
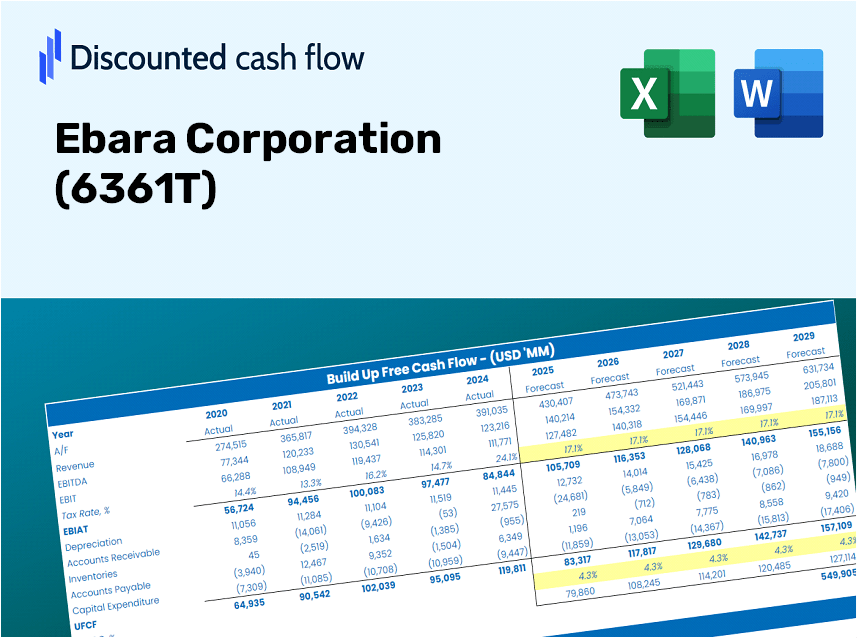
Discounted Cash Flow (DCF) - (USD MM)
| Year | AY1 2020 |
AY2 2021 |
AY3 2022 |
AY4 2023 |
AY5 2024 |
FY1 2025 |
FY2 2026 |
FY3 2027 |
FY4 2028 |
FY5 2029 |
|---|---|---|---|---|---|---|---|---|---|---|
| Revenue | 523,727.0 | 603,213.0 | 680,870.0 | 759,328.0 | 866,668.0 | 983,040.4 | 1,115,038.8 | 1,264,761.4 | 1,434,588.1 | 1,627,218.4 |
| Revenue Growth, % | 0 | 15.18 | 12.87 | 11.52 | 14.14 | 13.43 | 13.43 | 13.43 | 13.43 | 13.43 |
| EBITDA | 56,492.0 | 82,002.0 | 95,383.0 | 115,684.0 | 134,048.0 | 135,840.1 | 154,080.1 | 174,769.4 | 198,236.6 | 224,855.0 |
| EBITDA, % | 10.79 | 13.59 | 14.01 | 15.24 | 15.47 | 13.82 | 13.82 | 13.82 | 13.82 | 13.82 |
| Depreciation | 19,872.0 | 21,435.0 | 24,068.0 | 26,590.0 | 30,011.0 | 35,089.2 | 39,800.8 | 45,145.1 | 51,207.0 | 58,082.9 |
| Depreciation, % | 3.79 | 3.55 | 3.53 | 3.5 | 3.46 | 3.57 | 3.57 | 3.57 | 3.57 | 3.57 |
| EBIT | 36,620.0 | 60,567.0 | 71,315.0 | 89,094.0 | 104,037.0 | 100,750.9 | 114,279.3 | 129,624.2 | 147,029.6 | 166,772.1 |
| EBIT, % | 6.99 | 10.04 | 10.47 | 11.73 | 12 | 10.25 | 10.25 | 10.25 | 10.25 | 10.25 |
| Total Cash | 123,031.0 | 139,755.0 | 119,677.0 | 148,059.0 | 174,829.0 | 204,291.9 | 231,723.3 | 262,838.1 | 298,130.9 | 338,162.6 |
| Total Cash, percent | .0 | .0 | .0 | .0 | .0 | .0 | .0 | .0 | .0 | .0 |
| Account Receivables | 196,276.0 | 130,121.0 | 266,495.0 | 263,264.0 | 287,074.0 | 326,336.0 | 370,155.0 | 419,857.8 | 476,234.4 | 540,181.1 |
| Account Receivables, % | 37.48 | 21.57 | 39.14 | 34.67 | 33.12 | 33.2 | 33.2 | 33.2 | 33.2 | 33.2 |
| Inventories | 101,654.0 | 121,389.0 | 181,337.0 | 200,616.0 | 205,960.0 | 228,756.2 | 259,472.6 | 294,313.5 | 333,832.6 | 378,658.2 |
| Inventories, % | 19.41 | 20.12 | 26.63 | 26.42 | 23.76 | 23.27 | 23.27 | 23.27 | 23.27 | 23.27 |
| Accounts Payable | 126,118.0 | 148,799.0 | 174,675.0 | 172,368.0 | 167,452.0 | 228,900.4 | 259,636.1 | 294,499.0 | 334,043.0 | 378,896.8 |
| Accounts Payable, % | 24.08 | 24.67 | 25.65 | 22.7 | 19.32 | 23.28 | 23.28 | 23.28 | 23.28 | 23.28 |
| Capital Expenditure | -31,250.0 | -25,755.0 | -24,347.0 | -34,467.0 | -50,892.0 | -47,625.6 | -54,020.6 | -61,274.3 | -69,501.9 | -78,834.3 |
| Capital Expenditure, % | -5.97 | -4.27 | -3.58 | -4.54 | -5.87 | -4.84 | -4.84 | -4.84 | -4.84 | -4.84 |
| Tax Rate, % | 28.49 | 28.49 | 28.49 | 28.49 | 28.49 | 28.49 | 28.49 | 28.49 | 28.49 | 28.49 |
| EBITAT | 24,822.7 | 43,807.7 | 51,820.7 | 63,386.4 | 74,395.3 | 71,620.2 | 81,237.1 | 92,145.3 | 104,518.1 | 118,552.4 |
| Depreciation | ||||||||||
| Changes in Account Receivables | ||||||||||
| Changes in Inventories | ||||||||||
| Changes in Accounts Payable | ||||||||||
| Capital Expenditure | ||||||||||
| UFCF | -158,367.3 | 108,588.7 | -118,904.3 | 37,154.4 | 19,444.3 | 58,474.0 | 23,217.7 | 26,335.3 | 29,871.5 | 33,882.5 |
| WACC, % | 7.52 | 7.53 | 7.53 | 7.53 | 7.53 | 7.53 | 7.53 | 7.53 | 7.53 | 7.53 |
| PV UFCF | ||||||||||
| SUM PV UFCF | 141,565.6 | |||||||||
| Long Term Growth Rate, % | 3.00 | |||||||||
| Free cash flow (T + 1) | 34,899 | |||||||||
| Terminal Value | 771,115 | |||||||||
| Present Terminal Value | 536,483 | |||||||||
| Enterprise Value | 678,049 | |||||||||
| Net Debt | -20,599 | |||||||||
| Equity Value | 698,648 | |||||||||
| Diluted Shares Outstanding, MM | 462 | |||||||||
| Equity Value Per Share | 1,511.07 |
Benefits You Will Receive
- Authentic Ebara Data: Preloaded financial metrics – from revenue to EBIT – based on real and anticipated figures.
- Comprehensive Customization: Modify all essential parameters (yellow cells) such as WACC, growth %, and tax rates.
- Immediate Valuation Updates: Automatic recalculations to assess the effects of adjustments on Ebara's fair value.
- Flexible Excel Template: Designed for quick modifications, scenario evaluations, and detailed forecasting.
- Efficient and Precise: Eliminate the need to construct models from the ground up while ensuring accuracy and adaptability.
Key Features
- Pre-Loaded Data: Ebara Corporation’s historical financial statements and pre-filled forecasts.
- Fully Adjustable Inputs: Customize WACC, tax rates, revenue growth, and EBITDA margins.
- Instant Results: Monitor Ebara Corporation’s intrinsic value recalculating in real time.
- Clear Visual Outputs: Dashboard charts showcase valuation results and key metrics.
- Built for Accuracy: A professional tool tailored for analysts, investors, and finance professionals.
How It Works
- Download: Get access to a pre-prepared Excel file containing Ebara Corporation’s (6361T) financial data.
- Customize: Modify forecasts, such as revenue growth, EBITDA percentage, and WACC.
- Update Automatically: Enjoy real-time updates on intrinsic value and NPV calculations.
- Test Scenarios: Develop various projections and instantly compare the results.
- Make Decisions: Leverage the valuation findings to inform your investment approach.
Why Opt for the Ebara Corporation Calculator?
- All-in-One Solution: Features DCF, WACC, and financial ratio analyses all in a single tool.
- Flexible Inputs: Modify the yellow-highlighted cells to explore different scenarios.
- In-Depth Analysis: Automatically computes Ebara’s intrinsic value and Net Present Value.
- Preloaded Information: Historical and projected data provide reliable foundations for analysis.
- High-Quality Standards: Perfect for financial analysts, investors, and business consultants.
Who Can Benefit from Ebara Corporation (6361T)?
- Investors: Make informed investment choices with our advanced valuation tools.
- Financial Analysts: Streamline your analysis with a customizable DCF model at your disposal.
- Consultants: Effortlessly modify the framework for client presentations and reports.
- Finance Enthusiasts: Enhance your grasp of valuation methodologies through practical, real-world insights.
- Educators and Students: Utilize it as a hands-on resource for finance education and coursework.
Contents of the Template
- Historical Data: Features Ebara Corporation's past financial results and foundational forecasts.
- DCF and Levered DCF Models: Comprehensive templates to assess Ebara Corporation's intrinsic value.
- WACC Sheet: Pre-calculated figures for Weighted Average Cost of Capital.
- Editable Inputs: Customize key variables such as growth rates, EBITDA percentage, and CAPEX expectations.
- Quarterly and Annual Statements: An extensive analysis of Ebara Corporation's financials.
- Interactive Dashboard: Dynamically visualize valuation outcomes and forecasts.
Disclaimer
All information, articles, and product details provided on this website are for general informational and educational purposes only. We do not claim any ownership over, nor do we intend to infringe upon, any trademarks, copyrights, logos, brand names, or other intellectual property mentioned or depicted on this site. Such intellectual property remains the property of its respective owners, and any references here are made solely for identification or informational purposes, without implying any affiliation, endorsement, or partnership.
We make no representations or warranties, express or implied, regarding the accuracy, completeness, or suitability of any content or products presented. Nothing on this website should be construed as legal, tax, investment, financial, medical, or other professional advice. In addition, no part of this site—including articles or product references—constitutes a solicitation, recommendation, endorsement, advertisement, or offer to buy or sell any securities, franchises, or other financial instruments, particularly in jurisdictions where such activity would be unlawful.
All content is of a general nature and may not address the specific circumstances of any individual or entity. It is not a substitute for professional advice or services. Any actions you take based on the information provided here are strictly at your own risk. You accept full responsibility for any decisions or outcomes arising from your use of this website and agree to release us from any liability in connection with your use of, or reliance upon, the content or products found herein.