
|
Tsubakimoto Chain Co. (6371.T) Avaliação DCF |
Totalmente Editável: Adapte-Se Às Suas Necessidades No Excel Ou Planilhas
Design Profissional: Modelos Confiáveis E Padrão Da Indústria
Pré-Construídos Para Uso Rápido E Eficiente
Compatível com MAC/PC, totalmente desbloqueado
Não É Necessária Experiência; Fácil De Seguir
Tsubakimoto Chain Co. (6371.T) Bundle
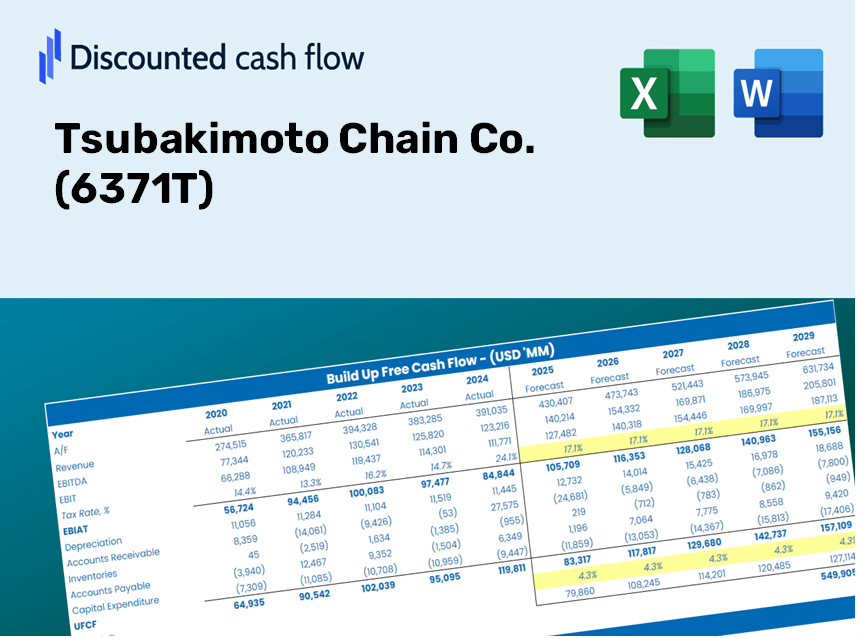
Avalie as perspectivas financeiras da Tsubakimoto Chain Co. como um especialista! Esta calculadora (6371T) DCF fornece dados financeiros pré-preenchidos e oferece total flexibilidade para modificar o crescimento da receita, o WACC, as margens e outras suposições essenciais para se alinhar às suas previsões.
Discounted Cash Flow (DCF) - (USD MM)
| Year | AY1 2020 |
AY2 2021 |
AY3 2022 |
AY4 2023 |
AY5 2024 |
FY1 2025 |
FY2 2026 |
FY3 2027 |
FY4 2028 |
FY5 2029 |
|---|---|---|---|---|---|---|---|---|---|---|
| Revenue | 193,399.0 | 215,879.0 | 251,574.0 | 266,812.0 | 279,193.0 | 306,313.7 | 336,068.8 | 368,714.3 | 404,531.0 | 443,826.9 |
| Revenue Growth, % | 0 | 11.62 | 16.53 | 6.06 | 4.64 | 9.71 | 9.71 | 9.71 | 9.71 | 9.71 |
| EBITDA | 21,857.0 | 33,350.0 | 32,333.0 | 40,282.0 | 44,889.0 | 43,360.5 | 47,572.5 | 52,193.7 | 57,263.7 | 62,826.3 |
| EBITDA, % | 11.3 | 15.45 | 12.85 | 15.1 | 16.08 | 14.16 | 14.16 | 14.16 | 14.16 | 14.16 |
| Depreciation | 12,959.0 | 12,973.0 | 13,758.0 | 14,067.0 | 14,423.0 | 17,531.6 | 19,234.6 | 21,103.0 | 23,152.9 | 25,402.0 |
| Depreciation, % | 6.7 | 6.01 | 5.47 | 5.27 | 5.17 | 5.72 | 5.72 | 5.72 | 5.72 | 5.72 |
| EBIT | 8,898.0 | 20,377.0 | 18,575.0 | 26,215.0 | 30,466.0 | 25,828.9 | 28,337.9 | 31,090.6 | 34,110.8 | 37,424.3 |
| EBIT, % | 4.6 | 9.44 | 7.38 | 9.83 | 10.91 | 8.43 | 8.43 | 8.43 | 8.43 | 8.43 |
| Total Cash | 48,058.0 | 55,443.0 | 59,582.0 | 77,924.0 | 68,725.0 | 78,438.6 | 86,058.1 | 94,417.7 | 103,589.4 | 113,652.0 |
| Total Cash, percent | .0 | .0 | .0 | .0 | .0 | .0 | .0 | .0 | .0 | .0 |
| Account Receivables | 54,512.0 | 58,439.0 | 62,387.0 | 66,412.0 | 63,628.0 | 78,254.6 | 85,856.2 | 94,196.3 | 103,346.4 | 113,385.5 |
| Account Receivables, % | 28.19 | 27.07 | 24.8 | 24.89 | 22.79 | 25.55 | 25.55 | 25.55 | 25.55 | 25.55 |
| Inventories | 38,388.0 | 49,007.0 | 55,881.0 | 58,156.0 | 56,159.0 | 65,351.5 | 71,699.7 | 78,664.6 | 86,306.0 | 94,689.8 |
| Inventories, % | 19.85 | 22.7 | 22.21 | 21.8 | 20.11 | 21.33 | 21.33 | 21.33 | 21.33 | 21.33 |
| Accounts Payable | 16,882.0 | 18,610.0 | 19,810.0 | 33,291.0 | 19,934.0 | 27,471.0 | 30,139.5 | 33,067.2 | 36,279.4 | 39,803.5 |
| Accounts Payable, % | 8.73 | 8.62 | 7.87 | 12.48 | 7.14 | 8.97 | 8.97 | 8.97 | 8.97 | 8.97 |
| Capital Expenditure | -9,723.0 | -8,004.0 | -8,922.0 | -10,844.0 | -13,159.0 | -12,901.3 | -14,154.6 | -15,529.5 | -17,038.1 | -18,693.1 |
| Capital Expenditure, % | -5.03 | -3.71 | -3.55 | -4.06 | -4.71 | -4.21 | -4.21 | -4.21 | -4.21 | -4.21 |
| Tax Rate, % | 26.66 | 26.66 | 26.66 | 26.66 | 26.66 | 26.66 | 26.66 | 26.66 | 26.66 | 26.66 |
| EBITAT | 6,371.1 | 14,757.4 | 13,954.6 | 18,781.0 | 22,342.3 | 18,809.9 | 20,637.1 | 22,641.8 | 24,841.2 | 27,254.3 |
| Depreciation | ||||||||||
| Changes in Account Receivables | ||||||||||
| Changes in Inventories | ||||||||||
| Changes in Accounts Payable | ||||||||||
| Capital Expenditure | ||||||||||
| UFCF | -66,410.9 | 6,908.4 | 9,168.6 | 29,185.0 | 15,030.3 | 7,158.0 | 14,435.8 | 15,838.1 | 17,376.6 | 19,064.6 |
| WACC, % | 7.65 | 7.65 | 7.66 | 7.65 | 7.66 | 7.65 | 7.65 | 7.65 | 7.65 | 7.65 |
| PV UFCF | ||||||||||
| SUM PV UFCF | 57,922.3 | |||||||||
| Long Term Growth Rate, % | 2.00 | |||||||||
| Free cash flow (T + 1) | 19,446 | |||||||||
| Terminal Value | 343,950 | |||||||||
| Present Terminal Value | 237,876 | |||||||||
| Enterprise Value | 295,798 | |||||||||
| Net Debt | -40,708 | |||||||||
| Equity Value | 336,506 | |||||||||
| Diluted Shares Outstanding, MM | 104 | |||||||||
| Equity Value Per Share | 3,234.64 |
Benefits You Will Receive
- Authentic Tsubakimoto Data: Comprehensive financials – encompassing everything from revenue to EBIT – derived from actual and projected metrics.
- Complete Customization: Modify all essential parameters (yellow cells) such as WACC, growth %, and tax rates.
- Immediate Valuation Adjustments: Automatic recalculations to evaluate the effects of changes on Tsubakimoto's fair value.
- Flexible Excel Template: Designed for quick modifications, scenario analysis, and in-depth forecasts.
- Efficient and Precise: Eliminate the need to build models from the ground up while ensuring accuracy and adaptability.
Key Features
- 🔍 Real-Life 6371T Financials: Pre-filled historical and projected data for Tsubakimoto Chain Co.
- ✏️ Fully Customizable Inputs: Modify all essential parameters (yellow cells) such as WACC, growth %, and tax rates.
- 📊 Professional DCF Valuation: Integrated formulas calculate Tsubakimoto's intrinsic value using the Discounted Cash Flow method.
- ⚡ Instant Results: See Tsubakimoto's valuation update instantly upon making adjustments.
- Scenario Analysis: Evaluate and compare results for different financial assumptions in a side-by-side format.
How It Works
- Step 1: Download the Excel file.
- Step 2: Review Tsubakimoto Chain Co.’s pre-filled financial data and projections.
- Step 3: Adjust key inputs such as revenue growth, WACC, and tax rates (highlighted cells).
- Step 4: Observe the DCF model update in real-time as you modify your assumptions.
- Step 5: Evaluate the results and use them to inform your investment decisions.
Why Choose Tsubakimoto Chain Co. (6371T) Calculator?
- Time-Saving: Skip the hassle of building a DCF model from the ground up – it’s ready for immediate use.
- Enhanced Accuracy: Dependable financial data and formulas minimize valuation errors.
- Completely Customizable: Adjust the model to align with your unique assumptions and forecasts.
- User-Friendly: Intuitive charts and outputs simplify the analysis of results.
- Endorsed by Professionals: Crafted for experts who prioritize accuracy and functionality.
Who Can Benefit from This Product?
- Individual Investors: Make informed choices regarding buying or selling Tsubakimoto Chain Co. (6371T) stock.
- Financial Analysts: Enhance valuation processes with ready-to-implement financial models tailored for Tsubakimoto Chain Co. (6371T).
- Consultants: Provide clients with precise valuation insights on Tsubakimoto Chain Co. (6371T) efficiently and effectively.
- Business Owners: Gain insights into the valuation of prominent companies like Tsubakimoto Chain Co. (6371T) to inform your own strategic decisions.
- Finance Students: Master valuation methods using practical data and scenarios related to Tsubakimoto Chain Co. (6371T).
Contents of the Template
- Pre-Filled DCF Model: Tsubakimoto Chain Co.’s (6371T) financial data preloaded for immediate analysis.
- WACC Calculator: Comprehensive calculations for the Weighted Average Cost of Capital.
- Financial Ratios: Assess Tsubakimoto Chain Co.’s (6371T) profitability, leverage, and efficiency metrics.
- Editable Inputs: Modify assumptions such as growth rates, margins, and capital expenditures to suit your scenarios.
- Financial Statements: Access annual and quarterly reports for in-depth analysis.
- Interactive Dashboard: Easily visualize essential valuation metrics and outcomes.
Disclaimer
All information, articles, and product details provided on this website are for general informational and educational purposes only. We do not claim any ownership over, nor do we intend to infringe upon, any trademarks, copyrights, logos, brand names, or other intellectual property mentioned or depicted on this site. Such intellectual property remains the property of its respective owners, and any references here are made solely for identification or informational purposes, without implying any affiliation, endorsement, or partnership.
We make no representations or warranties, express or implied, regarding the accuracy, completeness, or suitability of any content or products presented. Nothing on this website should be construed as legal, tax, investment, financial, medical, or other professional advice. In addition, no part of this site—including articles or product references—constitutes a solicitation, recommendation, endorsement, advertisement, or offer to buy or sell any securities, franchises, or other financial instruments, particularly in jurisdictions where such activity would be unlawful.
All content is of a general nature and may not address the specific circumstances of any individual or entity. It is not a substitute for professional advice or services. Any actions you take based on the information provided here are strictly at your own risk. You accept full responsibility for any decisions or outcomes arising from your use of this website and agree to release us from any liability in connection with your use of, or reliance upon, the content or products found herein.