
|
CKD Corporation (6407.T) Avaliação DCF |
Totalmente Editável: Adapte-Se Às Suas Necessidades No Excel Ou Planilhas
Design Profissional: Modelos Confiáveis E Padrão Da Indústria
Pré-Construídos Para Uso Rápido E Eficiente
Compatível com MAC/PC, totalmente desbloqueado
Não É Necessária Experiência; Fácil De Seguir
CKD Corporation (6407.T) Bundle
Descubra o verdadeiro valor da CKD Corporation (6407T) com nossa calculadora DCF avançada! Ajuste as principais suposições, avalie vários cenários e avalie como diferentes mudanças afetam a avaliação da corporação CKD (6407T) - tudo em um modelo abrangente do Excel.
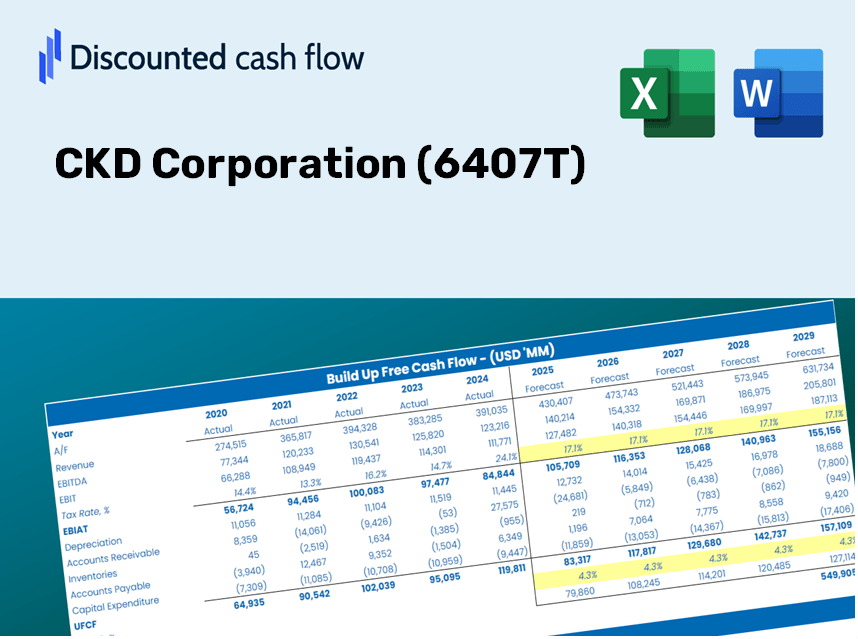
Discounted Cash Flow (DCF) - (USD MM)
| Year | AY1 2020 |
AY2 2021 |
AY3 2022 |
AY4 2023 |
AY5 2024 |
FY1 2025 |
FY2 2026 |
FY3 2027 |
FY4 2028 |
FY5 2029 |
|---|---|---|---|---|---|---|---|---|---|---|
| Revenue | 106,723.0 | 142,199.0 | 159,457.0 | 134,425.0 | 155,634.0 | 173,320.6 | 193,017.2 | 214,952.2 | 239,379.9 | 266,583.6 |
| Revenue Growth, % | 0 | 33.24 | 12.14 | -15.7 | 15.78 | 11.36 | 11.36 | 11.36 | 11.36 | 11.36 |
| EBITDA | 13,439.0 | 24,085.0 | 28,368.0 | 20,307.0 | 26,731.0 | 27,593.5 | 30,729.3 | 34,221.4 | 38,110.4 | 42,441.4 |
| EBITDA, % | 12.59 | 16.94 | 17.79 | 15.11 | 17.18 | 15.92 | 15.92 | 15.92 | 15.92 | 15.92 |
| Depreciation | 5,507.0 | 5,910.0 | 6,647.0 | 6,815.0 | 6,582.0 | 7,897.8 | 8,795.3 | 9,794.8 | 10,907.9 | 12,147.5 |
| Depreciation, % | 5.16 | 4.16 | 4.17 | 5.07 | 4.23 | 4.56 | 4.56 | 4.56 | 4.56 | 4.56 |
| EBIT | 7,932.0 | 18,175.0 | 21,721.0 | 13,492.0 | 20,149.0 | 19,695.7 | 21,934.0 | 24,426.6 | 27,202.6 | 30,293.9 |
| EBIT, % | 7.43 | 12.78 | 13.62 | 10.04 | 12.95 | 11.36 | 11.36 | 11.36 | 11.36 | 11.36 |
| Total Cash | 36,375.0 | 34,527.0 | 28,568.0 | 28,303.0 | 35,333.0 | 41,610.0 | 46,338.7 | 51,604.7 | 57,469.2 | 64,000.1 |
| Total Cash, percent | .0 | .0 | .0 | .0 | .0 | .0 | .0 | .0 | .0 | .0 |
| Account Receivables | 27,798.0 | 33,994.0 | 34,523.0 | 33,627.0 | 44,948.0 | 43,503.2 | 48,447.0 | 53,952.6 | 60,084.0 | 66,912.0 |
| Account Receivables, % | 26.05 | 23.91 | 21.65 | 25.02 | 28.88 | 25.1 | 25.1 | 25.1 | 25.1 | 25.1 |
| Inventories | 36,328.0 | 44,762.0 | 55,381.0 | 60,043.0 | 49,336.0 | 61,222.2 | 68,179.7 | 75,927.8 | 84,556.4 | 94,165.6 |
| Inventories, % | 34.04 | 31.48 | 34.73 | 44.67 | 31.7 | 35.32 | 35.32 | 35.32 | 35.32 | 35.32 |
| Accounts Payable | 18,193.0 | 20,354.0 | 27,366.0 | 15,325.0 | 15,317.0 | 24,183.3 | 26,931.6 | 29,992.2 | 33,400.6 | 37,196.3 |
| Accounts Payable, % | 17.05 | 14.31 | 17.16 | 11.4 | 9.84 | 13.95 | 13.95 | 13.95 | 13.95 | 13.95 |
| Capital Expenditure | -2,958.0 | -8,237.0 | -11,751.0 | -20,591.0 | -5,703.0 | -12,103.3 | -13,478.7 | -15,010.5 | -16,716.3 | -18,616.0 |
| Capital Expenditure, % | -2.77 | -5.79 | -7.37 | -15.32 | -3.66 | -6.98 | -6.98 | -6.98 | -6.98 | -6.98 |
| Tax Rate, % | 30.98 | 30.98 | 30.98 | 30.98 | 30.98 | 30.98 | 30.98 | 30.98 | 30.98 | 30.98 |
| EBITAT | 5,412.9 | 12,726.7 | 15,018.2 | 8,717.9 | 13,907.2 | 13,434.2 | 14,960.9 | 16,661.1 | 18,554.5 | 20,663.1 |
| Depreciation | ||||||||||
| Changes in Account Receivables | ||||||||||
| Changes in Inventories | ||||||||||
| Changes in Accounts Payable | ||||||||||
| Capital Expenditure | ||||||||||
| UFCF | -37,971.1 | -2,069.3 | 5,778.2 | -20,865.1 | 14,164.2 | 7,653.6 | 1,124.4 | 1,252.2 | 1,394.5 | 1,553.0 |
| WACC, % | 10.15 | 10.16 | 10.16 | 10.14 | 10.16 | 10.15 | 10.15 | 10.15 | 10.15 | 10.15 |
| PV UFCF | ||||||||||
| SUM PV UFCF | 10,716.4 | |||||||||
| Long Term Growth Rate, % | 2.00 | |||||||||
| Free cash flow (T + 1) | 1,584 | |||||||||
| Terminal Value | 19,427 | |||||||||
| Present Terminal Value | 11,978 | |||||||||
| Enterprise Value | 22,695 | |||||||||
| Net Debt | 468 | |||||||||
| Equity Value | 22,227 | |||||||||
| Diluted Shares Outstanding, MM | 67 | |||||||||
| Equity Value Per Share | 332.87 |
What You Will Receive
- Pre-Configured Financial Model: CKD Corporation's actual data supports accurate DCF valuation.
- Comprehensive Forecast Control: Modify revenue growth, profit margins, WACC, and other essential factors.
- Real-Time Calculations: Immediate updates allow you to see changes as you adjust inputs.
- Professional-Grade Template: A polished Excel file crafted for high-quality valuation presentations.
- Flexible and Reusable: Designed for adaptability, enabling ongoing use for in-depth forecasting.
Highlighted Features
- 🔍 Real-Time CKD Financials: Access pre-filled historical and projected data for CKD Corporation (6407T).
- ✏️ Customizable Parameters: Modify key inputs (yellow cells) such as WACC, growth %, and tax rates.
- 📊 Detailed DCF Valuation: Employ integrated formulas to determine the intrinsic value of CKD Corporation using the Discounted Cash Flow approach.
- ⚡ Instant Feedback: Immediately visualize CKD’s valuation following any adjustments.
- Scenario Analysis: Evaluate and compare different financial assumptions side-by-side.
How It Works
- Step 1: Download the prebuilt Excel template featuring CKD Corporation’s (6407T) data.
- Step 2: Examine the pre-filled worksheets to gain insights into key performance metrics.
- Step 3: Modify the forecasts and assumptions in the editable yellow cells (WACC, growth, margins).
- Step 4: Instantly view updated results, including the intrinsic value of CKD Corporation (6407T).
- Step 5: Utilize the outputs to make well-informed investment decisions or create detailed reports.
Why Opt for the CKD Corporation Calculator?
- Save Time: Skip the hassle of building a DCF model from the ground up – our tool is ready for immediate use.
- Enhance Accuracy: Dependable financial data and formulas minimize errors in your valuations.
- Fully Customizable: Adjust the model to align with your specific assumptions and forecasts.
- Easy to Understand: Intuitive charts and outputs simplify the analysis of results.
- Endorsed by Professionals: Crafted for experts who prioritize precision and user-friendliness.
Who Can Benefit from This Product?
- Finance Students: Master valuation methodologies and put them into practice with real data.
- Academics: Integrate professional financial models into your teaching or research projects.
- Investors: Evaluate your own theories and assess valuation results for CKD Corporation (6407T).
- Analysts: Enhance your productivity with a ready-to-use, customizable DCF model.
- Small Business Owners: Understand the analytical frameworks used for evaluating large public companies like CKD Corporation (6407T).
Contents of the Template
- Comprehensive DCF Model: An editable template featuring in-depth valuation computations.
- Real-World Data: CKD Corporation’s historical and projected financial figures preloaded for analysis.
- Customizable Parameters: Modify WACC, growth rates, and tax assumptions to explore various scenarios.
- Financial Statements: Complete annual and quarterly breakdowns for enhanced insights.
- Key Ratios: Integrated analysis for assessing profitability, efficiency, and leverage.
- Dashboard with Visual Outputs: Charts and tables designed to present clear, actionable results.
Disclaimer
All information, articles, and product details provided on this website are for general informational and educational purposes only. We do not claim any ownership over, nor do we intend to infringe upon, any trademarks, copyrights, logos, brand names, or other intellectual property mentioned or depicted on this site. Such intellectual property remains the property of its respective owners, and any references here are made solely for identification or informational purposes, without implying any affiliation, endorsement, or partnership.
We make no representations or warranties, express or implied, regarding the accuracy, completeness, or suitability of any content or products presented. Nothing on this website should be construed as legal, tax, investment, financial, medical, or other professional advice. In addition, no part of this site—including articles or product references—constitutes a solicitation, recommendation, endorsement, advertisement, or offer to buy or sell any securities, franchises, or other financial instruments, particularly in jurisdictions where such activity would be unlawful.
All content is of a general nature and may not address the specific circumstances of any individual or entity. It is not a substitute for professional advice or services. Any actions you take based on the information provided here are strictly at your own risk. You accept full responsibility for any decisions or outcomes arising from your use of this website and agree to release us from any liability in connection with your use of, or reliance upon, the content or products found herein.