
|
Max Co., Ltd. (6454.t) Avaliação DCF |
Totalmente Editável: Adapte-Se Às Suas Necessidades No Excel Ou Planilhas
Design Profissional: Modelos Confiáveis E Padrão Da Indústria
Pré-Construídos Para Uso Rápido E Eficiente
Compatível com MAC/PC, totalmente desbloqueado
Não É Necessária Experiência; Fácil De Seguir
Max Co., Ltd. (6454.T) Bundle
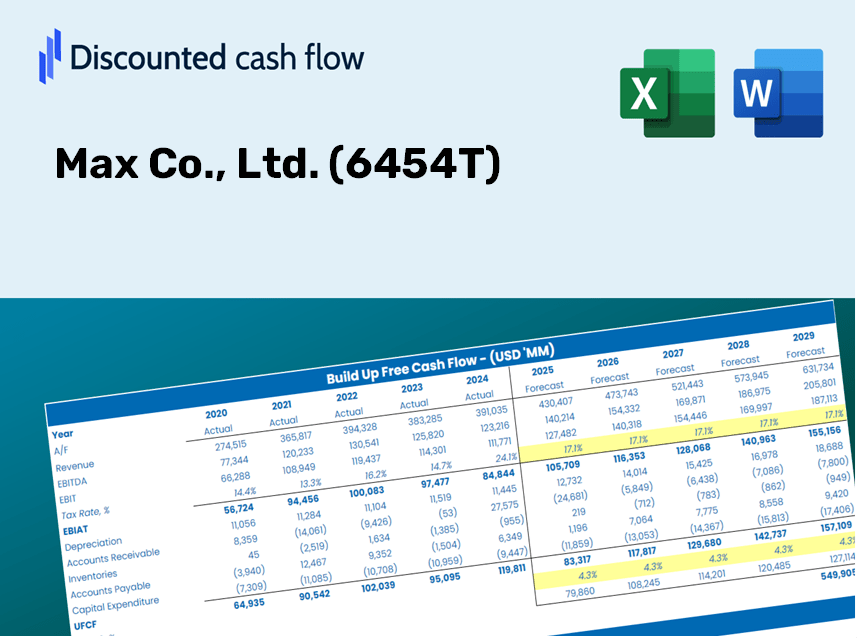
Procurando avaliar o valor intrínseco da Max Co., Ltd.? Nossa calculadora DCF (6454T) integra dados do mundo real com recursos abrangentes de personalização, permitindo refinar suas previsões e aprimorar suas opções de investimento.
Discounted Cash Flow (DCF) - (USD MM)
| Year | AY1 2020 |
AY2 2021 |
AY3 2022 |
AY4 2023 |
AY5 2024 |
FY1 2025 |
FY2 2026 |
FY3 2027 |
FY4 2028 |
FY5 2029 |
|---|---|---|---|---|---|---|---|---|---|---|
| Revenue | 64,029.0 | 73,958.0 | 84,316.0 | 86,638.0 | 91,839.0 | 100,625.5 | 110,252.7 | 120,801.0 | 132,358.4 | 145,021.6 |
| Revenue Growth, % | 0 | 15.51 | 14.01 | 2.75 | 6 | 9.57 | 9.57 | 9.57 | 9.57 | 9.57 |
| EBITDA | 9,208.0 | 11,117.0 | 12,948.0 | 16,788.0 | 18,545.0 | 16,973.3 | 18,597.2 | 20,376.5 | 22,326.0 | 24,462.0 |
| EBITDA, % | 14.38 | 15.03 | 15.36 | 19.38 | 20.19 | 16.87 | 16.87 | 16.87 | 16.87 | 16.87 |
| Depreciation | 2,522.0 | 2,811.0 | 3,022.0 | 3,054.0 | 3,309.0 | 3,713.5 | 4,068.7 | 4,458.0 | 4,884.5 | 5,351.8 |
| Depreciation, % | 3.94 | 3.8 | 3.58 | 3.53 | 3.6 | 3.69 | 3.69 | 3.69 | 3.69 | 3.69 |
| EBIT | 6,686.0 | 8,306.0 | 9,926.0 | 13,734.0 | 15,236.0 | 13,259.9 | 14,528.5 | 15,918.5 | 17,441.5 | 19,110.2 |
| EBIT, % | 10.44 | 11.23 | 11.77 | 15.85 | 16.59 | 13.18 | 13.18 | 13.18 | 13.18 | 13.18 |
| Total Cash | 25,329.0 | 28,112.0 | 33,818.0 | 38,219.0 | 43,662.0 | 42,128.6 | 46,159.2 | 50,575.4 | 55,414.1 | 60,715.7 |
| Total Cash, percent | .0 | .0 | .0 | .0 | .0 | .0 | .0 | .0 | .0 | .0 |
| Account Receivables | 12,627.0 | 13,779.0 | 14,716.0 | 15,766.0 | 15,552.0 | 18,301.1 | 20,052.0 | 21,970.4 | 24,072.4 | 26,375.5 |
| Account Receivables, % | 19.72 | 18.63 | 17.45 | 18.2 | 16.93 | 18.19 | 18.19 | 18.19 | 18.19 | 18.19 |
| Inventories | 8,504.0 | 11,184.0 | 13,865.0 | 13,947.0 | 13,354.0 | 15,191.7 | 16,645.2 | 18,237.7 | 19,982.5 | 21,894.3 |
| Inventories, % | 13.28 | 15.12 | 16.44 | 16.1 | 14.54 | 15.1 | 15.1 | 15.1 | 15.1 | 15.1 |
| Accounts Payable | 3,561.0 | 4,223.0 | 4,204.0 | 3,671.0 | 3,726.0 | 4,941.1 | 5,413.8 | 5,931.8 | 6,499.3 | 7,121.1 |
| Accounts Payable, % | 5.56 | 5.71 | 4.99 | 4.24 | 4.06 | 4.91 | 4.91 | 4.91 | 4.91 | 4.91 |
| Capital Expenditure | -5,229.0 | -4,387.0 | -3,605.0 | -2,962.0 | -2,746.0 | -4,987.6 | -5,464.7 | -5,987.6 | -6,560.4 | -7,188.1 |
| Capital Expenditure, % | -8.17 | -5.93 | -4.28 | -3.42 | -2.99 | -4.96 | -4.96 | -4.96 | -4.96 | -4.96 |
| Tax Rate, % | 26.18 | 26.18 | 26.18 | 26.18 | 26.18 | 26.18 | 26.18 | 26.18 | 26.18 | 26.18 |
| EBITAT | 4,899.5 | 6,132.1 | 7,342.3 | 10,461.7 | 11,246.7 | 9,840.6 | 10,782.1 | 11,813.7 | 12,943.9 | 14,182.3 |
| Depreciation | ||||||||||
| Changes in Account Receivables | ||||||||||
| Changes in Inventories | ||||||||||
| Changes in Accounts Payable | ||||||||||
| Capital Expenditure | ||||||||||
| UFCF | -15,377.5 | 1,386.1 | 3,122.3 | 8,888.7 | 12,671.7 | 5,194.8 | 6,654.5 | 7,291.1 | 7,988.7 | 8,753.0 |
| WACC, % | 6.19 | 6.19 | 6.19 | 6.19 | 6.19 | 6.19 | 6.19 | 6.19 | 6.19 | 6.19 |
| PV UFCF | ||||||||||
| SUM PV UFCF | 29,646.5 | |||||||||
| Long Term Growth Rate, % | 3.50 | |||||||||
| Free cash flow (T + 1) | 9,059 | |||||||||
| Terminal Value | 336,662 | |||||||||
| Present Terminal Value | 249,320 | |||||||||
| Enterprise Value | 278,967 | |||||||||
| Net Debt | -38,657 | |||||||||
| Equity Value | 317,624 | |||||||||
| Diluted Shares Outstanding, MM | 46 | |||||||||
| Equity Value Per Share | 6,841.74 |
What You Will Receive
- Adjustable Forecast Inputs: Effortlessly modify assumptions (growth %, margins, WACC) to explore various scenarios.
- Real-World Financials: Max Co., Ltd.’s financial data pre-loaded to accelerate your analysis.
- Automated DCF Outputs: The template computes Net Present Value (NPV) and intrinsic value automatically.
- Tailored and Professional: A sleek Excel model that can be customized to fit your valuation requirements.
- Designed for Analysts and Investors: Perfect for evaluating projections, confirming strategies, and enhancing efficiency.
Core Features
- Authentic Financial Data: Gain access to reliable pre-loaded historical figures and anticipated forecasts.
- Adjustable Forecast Parameters: Modify highlighted fields, such as WACC, growth rates, and profit margins.
- Real-Time Calculations: Automatic updates for DCF, Net Present Value (NPV), and cash flow assessments.
- Interactive Dashboard: User-friendly charts and summaries that help visualize your valuation insights.
- Designed for All Levels: A clear, intuitive layout suitable for investors, CFOs, and consultants alike.
How It Functions
- 1. Access the Template: Download and open the Excel file containing Max Co., Ltd.'s (6454T) preloaded data.
- 2. Modify Assumptions: Adjust key parameters such as growth rates, WACC, and capital expenditures as needed.
- 3. See Instant Results: The DCF model automatically calculates the intrinsic value and NPV for immediate insights.
- 4. Evaluate Scenarios: Analyze various forecasts to explore different valuation outcomes.
- 5. Present with Assurance: Deliver professional valuation analysis to reinforce your strategic decisions.
Why Opt for Max Co., Ltd. (6454T) Calculator?
- Precision: Leveraging authentic Max Co., Ltd. financials to guarantee data reliability.
- Versatility: Crafted for users to experiment with and adjust inputs effortlessly.
- Efficiency: Avoid the complexities of constructing a DCF model from ground zero.
- High-Quality: Engineered with the expertise and usability standards of CFO professionals.
- Intuitive: Simple to navigate, suitable for those without advanced financial modeling skills.
Who Should Utilize This Product?
- Investors: Determine the fair value of Max Co., Ltd. (6454T) accurately before making investment choices.
- CFOs: Utilize a high-quality DCF model for effective financial reporting and analysis.
- Consultants: Easily modify the template for client valuation reports.
- Entrepreneurs: Acquire insights into the financial modeling practices of leading corporations.
- Educators: Employ this resource as a teaching aid to illustrate valuation techniques.
Contents of the Template
- Pre-Filled DCF Model: Max Co., Ltd. (6454T)’s financial data preloaded for quick accessibility.
- WACC Calculator: Comprehensive calculations for the Weighted Average Cost of Capital.
- Financial Ratios: Assess Max Co., Ltd. (6454T)’s profitability, leverage, and operational efficiency.
- Editable Inputs: Modify assumptions like growth rates, margins, and CAPEX to suit your analysis.
- Financial Statements: Annual and quarterly reports available for thorough examination.
- Interactive Dashboard: Easily visualize essential valuation metrics and outcomes.
Disclaimer
All information, articles, and product details provided on this website are for general informational and educational purposes only. We do not claim any ownership over, nor do we intend to infringe upon, any trademarks, copyrights, logos, brand names, or other intellectual property mentioned or depicted on this site. Such intellectual property remains the property of its respective owners, and any references here are made solely for identification or informational purposes, without implying any affiliation, endorsement, or partnership.
We make no representations or warranties, express or implied, regarding the accuracy, completeness, or suitability of any content or products presented. Nothing on this website should be construed as legal, tax, investment, financial, medical, or other professional advice. In addition, no part of this site—including articles or product references—constitutes a solicitation, recommendation, endorsement, advertisement, or offer to buy or sell any securities, franchises, or other financial instruments, particularly in jurisdictions where such activity would be unlawful.
All content is of a general nature and may not address the specific circumstances of any individual or entity. It is not a substitute for professional advice or services. Any actions you take based on the information provided here are strictly at your own risk. You accept full responsibility for any decisions or outcomes arising from your use of this website and agree to release us from any liability in connection with your use of, or reliance upon, the content or products found herein.