
|
Sega Sammy Holdings Inc. (6460.T) Avaliação DCF |
Totalmente Editável: Adapte-Se Às Suas Necessidades No Excel Ou Planilhas
Design Profissional: Modelos Confiáveis E Padrão Da Indústria
Pré-Construídos Para Uso Rápido E Eficiente
Compatível com MAC/PC, totalmente desbloqueado
Não É Necessária Experiência; Fácil De Seguir
Sega Sammy Holdings Inc. (6460.T) Bundle
Atualizar sua análise e aumentar a precisão com a nossa calculadora DCF (6460T)! Utilizando dados reais da Sega Sammy Holdings Inc. e suposições personalizáveis, essa ferramenta capacita você a prever, avaliar e avaliar (6460T) como um investidor especializado.
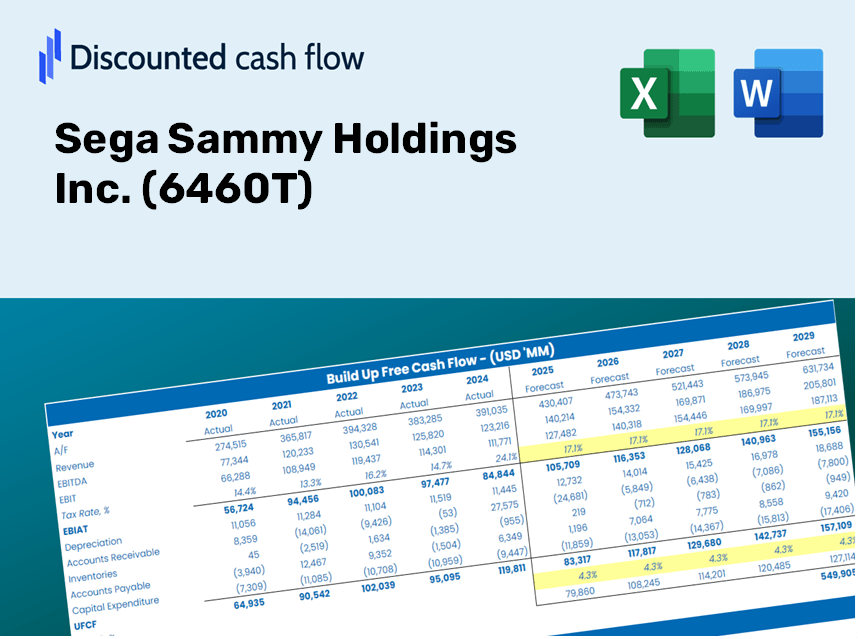
Discounted Cash Flow (DCF) - (USD MM)
| Year | AY1 2021 |
AY2 2022 |
AY3 2023 |
AY4 2024 |
AY5 2025 |
FY1 2026 |
FY2 2027 |
FY3 2028 |
FY4 2029 |
FY5 2030 |
|---|---|---|---|---|---|---|---|---|---|---|
| Revenue | 277,748.0 | 320,949.0 | 389,635.0 | 467,896.0 | 428,948.0 | 481,190.2 | 539,795.1 | 605,537.5 | 679,286.8 | 762,018.1 |
| Revenue Growth, % | 0 | 15.55 | 21.4 | 20.09 | -8.32 | 12.18 | 12.18 | 12.18 | 12.18 | 12.18 |
| EBITDA | 7,360.0 | 51,939.0 | 60,237.0 | 58,612.0 | 72,732.0 | 61,376.1 | 68,851.2 | 77,236.7 | 86,643.4 | 97,195.9 |
| EBITDA, % | 2.65 | 16.18 | 15.46 | 12.53 | 16.96 | 12.76 | 12.76 | 12.76 | 12.76 | 12.76 |
| Depreciation | 16,734.0 | 13,717.0 | 12,847.0 | 16,015.0 | 16,107.0 | 19,992.2 | 22,427.1 | 25,158.5 | 28,222.6 | 31,659.9 |
| Depreciation, % | 6.02 | 4.27 | 3.3 | 3.42 | 3.76 | 4.15 | 4.15 | 4.15 | 4.15 | 4.15 |
| EBIT | -9,374.0 | 38,222.0 | 47,390.0 | 42,597.0 | 56,625.0 | 41,383.9 | 46,424.1 | 52,078.1 | 58,420.8 | 65,535.9 |
| EBIT, % | -3.38 | 11.91 | 12.16 | 9.1 | 13.2 | 8.6 | 8.6 | 8.6 | 8.6 | 8.6 |
| Total Cash | 155,693.0 | 152,459.0 | 179,509.0 | 219,810.0 | 200,360.0 | 234,163.6 | 262,682.8 | 294,675.3 | 330,564.2 | 370,824.1 |
| Total Cash, percent | .0 | .0 | .0 | .0 | .0 | .0 | .0 | .0 | .0 | .0 |
| Account Receivables | 37,878.0 | 38,629.0 | 53,066.0 | 53,826.0 | 52,653.0 | 60,698.8 | 68,091.5 | 76,384.4 | 85,687.4 | 96,123.4 |
| Account Receivables, % | 13.64 | 12.04 | 13.62 | 11.5 | 12.27 | 12.61 | 12.61 | 12.61 | 12.61 | 12.61 |
| Inventories | 52,911.0 | 67,525.0 | 89,461.0 | 81,760.0 | 93,678.0 | 98,511.5 | 110,509.4 | 123,968.5 | 139,066.8 | 156,003.9 |
| Inventories, % | 19.05 | 21.04 | 22.96 | 17.47 | 21.84 | 20.47 | 20.47 | 20.47 | 20.47 | 20.47 |
| Accounts Payable | 16,994.0 | 24,455.0 | 30,556.0 | 26,085.0 | 23,560.0 | 31,419.6 | 35,246.2 | 39,538.9 | 44,354.4 | 49,756.4 |
| Accounts Payable, % | 6.12 | 7.62 | 7.84 | 5.57 | 5.49 | 6.53 | 6.53 | 6.53 | 6.53 | 6.53 |
| Capital Expenditure | -15,008.0 | -11,861.0 | -10,819.0 | -11,115.0 | -11,860.0 | -16,376.1 | -18,370.5 | -20,607.9 | -23,117.8 | -25,933.3 |
| Capital Expenditure, % | -5.4 | -3.7 | -2.78 | -2.38 | -2.76 | -3.4 | -3.4 | -3.4 | -3.4 | -3.4 |
| Tax Rate, % | 17.79 | 17.79 | 17.79 | 17.79 | 17.79 | 17.79 | 17.79 | 17.79 | 17.79 | 17.79 |
| EBITAT | 1,213.2 | 37,320.9 | 46,251.3 | 33,660.3 | 46,548.8 | 29,503.8 | 33,097.1 | 37,128.1 | 41,650.0 | 46,722.6 |
| Depreciation | ||||||||||
| Changes in Account Receivables | ||||||||||
| Changes in Inventories | ||||||||||
| Changes in Accounts Payable | ||||||||||
| Capital Expenditure | ||||||||||
| UFCF | -70,855.8 | 31,272.9 | 18,007.3 | 41,030.3 | 37,525.8 | 28,100.2 | 21,589.9 | 24,219.4 | 27,169.1 | 30,478.1 |
| WACC, % | 3.63 | 4.33 | 4.33 | 4.2 | 4.22 | 4.14 | 4.14 | 4.14 | 4.14 | 4.14 |
| PV UFCF | ||||||||||
| SUM PV UFCF | 116,318.4 | |||||||||
| Long Term Growth Rate, % | 3.00 | |||||||||
| Free cash flow (T + 1) | 31,392 | |||||||||
| Terminal Value | 2,754,607 | |||||||||
| Present Terminal Value | 2,248,949 | |||||||||
| Enterprise Value | 2,365,267 | |||||||||
| Net Debt | -46,221 | |||||||||
| Equity Value | 2,411,488 | |||||||||
| Diluted Shares Outstanding, MM | 216 | |||||||||
| Equity Value Per Share | 11,188.17 |
Benefits of Choosing Sega Sammy Holdings Inc. (6460T)
- Comprehensive Financial Model: Leverage Sega's actual data for an accurate DCF valuation.
- Complete Forecast Flexibility: Modify key variables such as revenue growth, profit margins, WACC, and more.
- Real-Time Calculations: Automatic updates keep you informed of results as you adjust inputs.
- Professional-Grade Template: A polished Excel file crafted for serious valuation analysis.
- Adaptable and Reusable: Designed for versatility, enabling repeated use for in-depth forecasting.
Key Features
- Comprehensive SEGA Data: Pre-loaded with Sega Sammy Holdings Inc.'s historical financials and future projections.
- Fully Customizable Inputs: Modify parameters such as revenue growth, profit margins, WACC, tax rates, and capital expenditures.
- Dynamic Valuation Model: Automatic recalculations of Net Present Value (NPV) and intrinsic value based on your preferences.
- Scenario Testing: Develop various forecasting scenarios to explore different valuation possibilities.
- User-Friendly Interface: Intuitive, organized, and suitable for both professionals and novices.
How It Works
- Step 1: Download the Excel file.
- Step 2: Examine the pre-filled Sega Sammy data (both historical and projected).
- Step 3: Modify key assumptions (highlighted in yellow) based on your insights.
- Step 4: Observe the automatic recalculations for Sega Sammy's intrinsic value.
- Step 5: Utilize the results for your investment strategies or reporting needs.
Why Choose the Sega Sammy Holdings Inc. (6460T) Calculator?
- Designed for Experts: A sophisticated tool utilized by analysts, CFOs, and consultants in the industry.
- Comprehensive Data: Sega Sammy's historical and projected financials are preloaded for precise analysis.
- Flexible Scenario Analysis: Effortlessly test various forecasts and assumptions.
- Clear Results: Automatically computes intrinsic value, NPV, and essential financial metrics.
- User-Friendly: Step-by-step guidance ensures a smooth experience throughout the process.
Who Can Benefit from This Product?
- Individual Investors: Make well-informed choices regarding the purchase or sale of Sega Sammy Holdings Inc. (6460T) stock.
- Financial Analysts: Enhance valuation procedures with easy-to-use financial models tailored for Sega Sammy Holdings Inc. (6460T).
- Consultants: Provide clients with expert valuation insights on Sega Sammy Holdings Inc. (6460T) efficiently and accurately.
- Business Owners: Gain insights into how major corporations like Sega Sammy Holdings Inc. (6460T) are valued, aiding in shaping your own business strategies.
- Finance Students: Master valuation methodologies by working with real-world data and scenarios related to Sega Sammy Holdings Inc. (6460T).
Contents of the Template
- Pre-Filled DCF Model: Sega Sammy Holdings Inc.'s (6460T) financial data preloaded for immediate use.
- WACC Calculator: Comprehensive calculations for the Weighted Average Cost of Capital.
- Financial Ratios: Assess Sega Sammy’s profitability, leverage, and operational efficiency.
- Editable Inputs: Adjust assumptions such as growth rates, profit margins, and capital expenditures to tailor your analysis.
- Financial Statements: Access annual and quarterly reports for in-depth evaluation.
- Interactive Dashboard: Effortlessly visualize essential valuation metrics and outcomes.
Disclaimer
All information, articles, and product details provided on this website are for general informational and educational purposes only. We do not claim any ownership over, nor do we intend to infringe upon, any trademarks, copyrights, logos, brand names, or other intellectual property mentioned or depicted on this site. Such intellectual property remains the property of its respective owners, and any references here are made solely for identification or informational purposes, without implying any affiliation, endorsement, or partnership.
We make no representations or warranties, express or implied, regarding the accuracy, completeness, or suitability of any content or products presented. Nothing on this website should be construed as legal, tax, investment, financial, medical, or other professional advice. In addition, no part of this site—including articles or product references—constitutes a solicitation, recommendation, endorsement, advertisement, or offer to buy or sell any securities, franchises, or other financial instruments, particularly in jurisdictions where such activity would be unlawful.
All content is of a general nature and may not address the specific circumstances of any individual or entity. It is not a substitute for professional advice or services. Any actions you take based on the information provided here are strictly at your own risk. You accept full responsibility for any decisions or outcomes arising from your use of this website and agree to release us from any liability in connection with your use of, or reliance upon, the content or products found herein.