
|
MEIDENSHA CORPORATION (6508.T) Avaliação DCF |
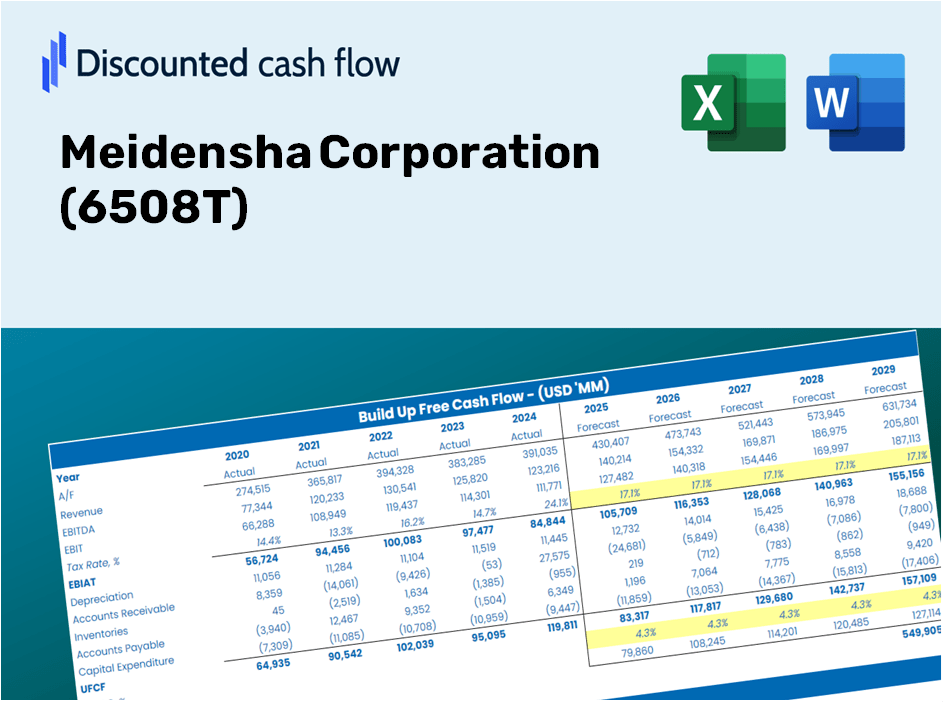
Totalmente Editável: Adapte-Se Às Suas Necessidades No Excel Ou Planilhas
Design Profissional: Modelos Confiáveis E Padrão Da Indústria
Pré-Construídos Para Uso Rápido E Eficiente
Compatível com MAC/PC, totalmente desbloqueado
Não É Necessária Experiência; Fácil De Seguir
Meidensha Corporation (6508.T) Bundle
Aprimore suas estratégias de investimento com a calculadora DCF (6508T)! Explore os dados financeiros da Authentic Meidensha Corporation, ajustam as projeções e despesas de crescimento e observe instantaneamente como essas modificações afetam o valor intrínseco de (6508T).
Discounted Cash Flow (DCF) - (USD MM)
| Year | AY1 2020 |
AY2 2021 |
AY3 2022 |
AY4 2023 |
AY5 2024 |
FY1 2025 |
FY2 2026 |
FY3 2027 |
FY4 2028 |
FY5 2029 |
|---|---|---|---|---|---|---|---|---|---|---|
| Revenue | 231,254.0 | 255,046.0 | 272,578.0 | 287,880.0 | 301,101.0 | 321,702.8 | 343,714.3 | 367,231.7 | 392,358.3 | 419,204.1 |
| Revenue Growth, % | 0 | 10.29 | 6.87 | 5.61 | 4.59 | 6.84 | 6.84 | 6.84 | 6.84 | 6.84 |
| EBITDA | 22,234.0 | 23,082.0 | 22,383.0 | 27,673.0 | 35,982.0 | 31,166.0 | 33,298.4 | 35,576.7 | 38,011.0 | 40,611.7 |
| EBITDA, % | 9.61 | 9.05 | 8.21 | 9.61 | 11.95 | 9.69 | 9.69 | 9.69 | 9.69 | 9.69 |
| Depreciation | 10,447.0 | 12,534.0 | 11,163.0 | 11,010.0 | 11,162.0 | 13,549.4 | 14,476.5 | 15,467.0 | 16,525.2 | 17,655.9 |
| Depreciation, % | 4.52 | 4.91 | 4.1 | 3.82 | 3.71 | 4.21 | 4.21 | 4.21 | 4.21 | 4.21 |
| EBIT | 11,787.0 | 10,548.0 | 11,220.0 | 16,663.0 | 24,820.0 | 17,616.6 | 18,821.9 | 20,109.8 | 21,485.7 | 22,955.8 |
| EBIT, % | 5.1 | 4.14 | 4.12 | 5.79 | 8.24 | 5.48 | 5.48 | 5.48 | 5.48 | 5.48 |
| Total Cash | 14,307.0 | 14,070.0 | 14,917.0 | 18,984.0 | 30,679.0 | 21,849.6 | 23,344.6 | 24,941.8 | 26,648.4 | 28,471.7 |
| Total Cash, percent | .0 | .0 | .0 | .0 | .0 | .0 | .0 | .0 | .0 | .0 |
| Account Receivables | 94,038.0 | 100,618.0 | 107,930.0 | 115,400.0 | 112,118.0 | 126,772.4 | 135,446.4 | 144,713.9 | 154,615.4 | 165,194.5 |
| Account Receivables, % | 40.66 | 39.45 | 39.6 | 40.09 | 37.24 | 39.41 | 39.41 | 39.41 | 39.41 | 39.41 |
| Inventories | 43,855.0 | 50,714.0 | 58,738.0 | 67,223.0 | 67,810.0 | 68,374.1 | 73,052.4 | 78,050.7 | 83,391.1 | 89,096.8 |
| Inventories, % | 18.96 | 19.88 | 21.55 | 23.35 | 22.52 | 21.25 | 21.25 | 21.25 | 21.25 | 21.25 |
| Accounts Payable | 35,928.0 | 39,165.0 | 42,968.0 | 40,156.0 | 37,040.0 | 46,908.2 | 50,117.8 | 53,546.9 | 57,210.7 | 61,125.1 |
| Accounts Payable, % | 15.54 | 15.36 | 15.76 | 13.95 | 12.3 | 14.58 | 14.58 | 14.58 | 14.58 | 14.58 |
| Capital Expenditure | -15,615.0 | -8,913.0 | -12,395.0 | -9,343.0 | -10,547.0 | -13,860.6 | -14,809.0 | -15,822.2 | -16,904.8 | -18,061.5 |
| Capital Expenditure, % | -6.75 | -3.49 | -4.55 | -3.25 | -3.5 | -4.31 | -4.31 | -4.31 | -4.31 | -4.31 |
| Tax Rate, % | 22.44 | 22.44 | 22.44 | 22.44 | 22.44 | 22.44 | 22.44 | 22.44 | 22.44 | 22.44 |
| EBITAT | 7,615.7 | 7,113.3 | 7,692.2 | 11,850.0 | 19,250.2 | 12,306.3 | 13,148.3 | 14,048.0 | 15,009.2 | 16,036.1 |
| Depreciation | ||||||||||
| Changes in Account Receivables | ||||||||||
| Changes in Inventories | ||||||||||
| Changes in Accounts Payable | ||||||||||
| Capital Expenditure | ||||||||||
| UFCF | -99,517.3 | 532.3 | -5,072.8 | -5,250.0 | 19,444.2 | 6,644.8 | 2,673.1 | 2,856.0 | 3,051.4 | 3,260.2 |
| WACC, % | 7.02 | 7.04 | 7.04 | 7.06 | 7.09 | 7.05 | 7.05 | 7.05 | 7.05 | 7.05 |
| PV UFCF | ||||||||||
| SUM PV UFCF | 15,511.0 | |||||||||
| Long Term Growth Rate, % | 3.00 | |||||||||
| Free cash flow (T + 1) | 3,358 | |||||||||
| Terminal Value | 82,938 | |||||||||
| Present Terminal Value | 58,999 | |||||||||
| Enterprise Value | 74,510 | |||||||||
| Net Debt | 13,886 | |||||||||
| Equity Value | 60,624 | |||||||||
| Diluted Shares Outstanding, MM | 45 | |||||||||
| Equity Value Per Share | 1,336.32 |
What You Will Receive
- Authentic Meidensha Data: Preloaded financial metrics – encompassing revenue, EBIT, and more – derived from actual and projected statistics.
- Comprehensive Customization: Modify all key parameters (highlighted cells) such as WACC, growth rates, and tax percentages.
- Instant Valuation Adjustments: Automatic recalculations to assess the effects of modifications on Meidensha’s fair value.
- Flexible Excel Template: Designed for quick adjustments, scenario analysis, and detailed forecasts.
- Efficient and Precise: Eliminate the need to construct models from the ground up while ensuring accuracy and adaptability.
Key Features
- Customizable Forecast Inputs: Adjust essential variables such as revenue growth, EBITDA margin, and capital expenses.
- Instant DCF Valuation: Automatically computes intrinsic value, NPV, and other financial metrics in real-time.
- High Precision Accuracy: Leverages Meidensha Corporation's (6508T) actual financial data for credible valuation results.
- Simplified Scenario Analysis: Effortlessly evaluate various assumptions and analyze different outcomes.
- Efficiency Enhancer: Save time by avoiding the need to create complex valuation models from the ground up.
How It Works
- Step 1: Download the prebuilt Excel template that includes Meidensha Corporation's data.
- Step 2: Review the pre-filled sheets to familiarize yourself with the key metrics.
- Step 3: Update the forecasts and assumptions in the editable yellow cells (WACC, growth, margins).
- Step 4: Instantly view recalculated results, including Meidensha Corporation's intrinsic value.
- Step 5: Make informed investment decisions or generate reports based on the outputs.
Why Choose This Calculator for Meidensha Corporation (6508T)?
- Accurate Financial Insights: Utilize actual Meidensha Corporation financial data for dependable valuation outcomes.
- Customizable Features: Tailor essential parameters such as growth rates, WACC, and tax rates to align with your forecasts.
- Efficiency Boost: Ready-to-use calculations save you the hassle of building from the ground up.
- Professional Standard: Crafted for investors, analysts, and consultants in the field.
- User-Friendly Design: An intuitive interface and clear instructions make it accessible for everyone.
Who Should Utilize This Product?
- Finance Students: Master valuation strategies and put them to the test with actual data.
- Academics: Integrate industry-standard models into your teaching or research pursuits.
- Investors: Validate your hypotheses and assess valuation results for Meidensha Corporation (6508T).
- Analysts: Enhance your efficiency with a ready-made, adaptable DCF model.
- Small Business Owners: Discover how major public firms like Meidensha Corporation (6508T) are evaluated.
Components of the Template
- Operating and Balance Sheet Data: Pre-filled historical data and forecasts for Meidensha Corporation (6508T), including metrics such as revenue, EBITDA, EBIT, and capital expenditures.
- WACC Calculation: A dedicated worksheet for the Weighted Average Cost of Capital (WACC), featuring parameters such as Beta, risk-free rate, and share price.
- DCF Valuation (Unlevered and Levered): Customizable Discounted Cash Flow models with detailed calculations to reveal intrinsic value.
- Financial Statements: Pre-loaded annual and quarterly financial statements to facilitate thorough analysis.
- Key Ratios: A comprehensive set of profitability, leverage, and efficiency ratios specific to Meidensha Corporation (6508T).
- Dashboard and Charts: An overview of valuation outputs and assumptions presented visually for easy result analysis.
Disclaimer
All information, articles, and product details provided on this website are for general informational and educational purposes only. We do not claim any ownership over, nor do we intend to infringe upon, any trademarks, copyrights, logos, brand names, or other intellectual property mentioned or depicted on this site. Such intellectual property remains the property of its respective owners, and any references here are made solely for identification or informational purposes, without implying any affiliation, endorsement, or partnership.
We make no representations or warranties, express or implied, regarding the accuracy, completeness, or suitability of any content or products presented. Nothing on this website should be construed as legal, tax, investment, financial, medical, or other professional advice. In addition, no part of this site—including articles or product references—constitutes a solicitation, recommendation, endorsement, advertisement, or offer to buy or sell any securities, franchises, or other financial instruments, particularly in jurisdictions where such activity would be unlawful.
All content is of a general nature and may not address the specific circumstances of any individual or entity. It is not a substitute for professional advice or services. Any actions you take based on the information provided here are strictly at your own risk. You accept full responsibility for any decisions or outcomes arising from your use of this website and agree to release us from any liability in connection with your use of, or reliance upon, the content or products found herein.