
|
Baycurrent Consulting, Inc. (6532.T) Avaliação DCF |
Totalmente Editável: Adapte-Se Às Suas Necessidades No Excel Ou Planilhas
Design Profissional: Modelos Confiáveis E Padrão Da Indústria
Pré-Construídos Para Uso Rápido E Eficiente
Compatível com MAC/PC, totalmente desbloqueado
Não É Necessária Experiência; Fácil De Seguir
BayCurrent Consulting, Inc. (6532.T) Bundle
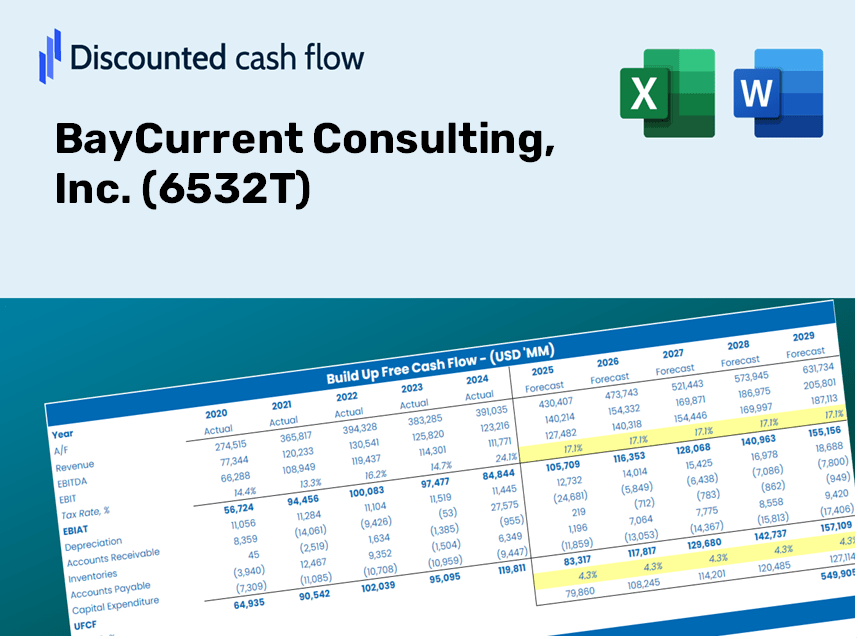
Avalie as perspectivas financeiras da Baycurrent Consulting, Inc. como um especialista! Esta calculadora DCF (6532T) fornece dados financeiros pré-preenchidos e flexibilidade total para modificar o crescimento da receita, o WACC, as margens e outras suposições cruciais para se alinhar às suas projeções.
Discounted Cash Flow (DCF) - (USD MM)
| Year | AY1 2021 |
AY2 2022 |
AY3 2023 |
AY4 2024 |
AY5 2025 |
FY1 2026 |
FY2 2027 |
FY3 2028 |
FY4 2029 |
FY5 2030 |
|---|---|---|---|---|---|---|---|---|---|---|
| Revenue | 42,873.0 | 57,642.0 | 76,090.0 | 93,909.0 | 116,056.0 | 148,973.7 | 191,228.0 | 245,467.2 | 315,090.6 | 404,461.7 |
| Revenue Growth, % | 0 | 34.45 | 32 | 23.42 | 23.58 | 28.36 | 28.36 | 28.36 | 28.36 | 28.36 |
| EBITDA | 14,525.0 | 22,359.0 | 30,980.0 | 36,633.0 | 45,104.0 | 56,984.4 | 73,147.2 | 93,894.4 | 120,526.3 | 154,711.9 |
| EBITDA, % | 33.88 | 38.79 | 40.71 | 39.01 | 38.86 | 38.25 | 38.25 | 38.25 | 38.25 | 38.25 |
| Depreciation | 990.0 | 841.0 | 1,065.0 | 2,417.0 | 2,489.0 | 2,945.6 | 3,781.0 | 4,853.5 | 6,230.1 | 7,997.2 |
| Depreciation, % | 2.31 | 1.46 | 1.4 | 2.57 | 2.14 | 1.98 | 1.98 | 1.98 | 1.98 | 1.98 |
| EBIT | 13,535.0 | 21,518.0 | 29,915.0 | 34,216.0 | 42,615.0 | 54,038.8 | 69,366.2 | 89,040.9 | 114,296.2 | 146,714.7 |
| EBIT, % | 31.57 | 37.33 | 39.32 | 36.44 | 36.72 | 36.27 | 36.27 | 36.27 | 36.27 | 36.27 |
| Total Cash | 16,360.0 | 26,054.0 | 36,606.0 | 45,778.0 | 63,552.0 | 70,010.1 | 89,867.5 | 115,357.2 | 148,076.6 | 190,076.5 |
| Total Cash, percent | .0 | .0 | .0 | .0 | .0 | .0 | .0 | .0 | .0 | .0 |
| Account Receivables | 5,750.0 | 8,558.0 | 12,117.0 | 16,861.0 | 22,699.0 | 24,341.2 | 31,245.3 | 40,107.6 | 51,483.5 | 66,086.1 |
| Account Receivables, % | 13.41 | 14.85 | 15.92 | 17.95 | 19.56 | 16.34 | 16.34 | 16.34 | 16.34 | 16.34 |
| Inventories | 543.0 | 613.0 | 463.0 | 669.0 | 919.0 | 1,323.7 | 1,699.1 | 2,181.1 | 2,799.7 | 3,593.8 |
| Inventories, % | 1.27 | 1.06 | 0.60849 | 0.71239 | 0.79186 | 0.88855 | 0.88855 | 0.88855 | 0.88855 | 0.88855 |
| Accounts Payable | .0 | .0 | .0 | .0 | .0 | .0 | .0 | .0 | .0 | .0 |
| Accounts Payable, % | 0 | 0 | 0 | 0 | 0 | 0 | 0 | 0 | 0 | 0 |
| Capital Expenditure | -204.0 | -75.0 | -386.0 | -3,632.0 | -866.0 | -1,706.3 | -2,190.3 | -2,811.6 | -3,609.0 | -4,632.7 |
| Capital Expenditure, % | -0.47582 | -0.13011 | -0.50729 | -3.87 | -0.74619 | -1.15 | -1.15 | -1.15 | -1.15 | -1.15 |
| Tax Rate, % | 27.7 | 27.7 | 27.7 | 27.7 | 27.7 | 27.7 | 27.7 | 27.7 | 27.7 | 27.7 |
| EBITAT | 10,057.1 | 15,579.5 | 21,939.3 | 25,423.6 | 30,809.9 | 39,626.3 | 50,865.8 | 65,293.1 | 83,812.6 | 107,585.0 |
| Depreciation | ||||||||||
| Changes in Account Receivables | ||||||||||
| Changes in Inventories | ||||||||||
| Changes in Accounts Payable | ||||||||||
| Capital Expenditure | ||||||||||
| UFCF | 4,550.1 | 13,467.5 | 19,209.3 | 19,258.6 | 26,344.9 | 38,818.6 | 45,177.0 | 57,990.8 | 74,439.1 | 95,552.8 |
| WACC, % | 9.65 | 9.65 | 9.65 | 9.65 | 9.65 | 9.65 | 9.65 | 9.65 | 9.65 | 9.65 |
| PV UFCF | ||||||||||
| SUM PV UFCF | 228,753.3 | |||||||||
| Long Term Growth Rate, % | 3.50 | |||||||||
| Free cash flow (T + 1) | 98,897 | |||||||||
| Terminal Value | 1,608,429 | |||||||||
| Present Terminal Value | 1,014,811 | |||||||||
| Enterprise Value | 1,243,564 | |||||||||
| Net Debt | -52,470 | |||||||||
| Equity Value | 1,296,034 | |||||||||
| Diluted Shares Outstanding, MM | 152 | |||||||||
| Equity Value Per Share | 8,518.02 |
What You Will Receive
- Authentic BC Financial Data: Pre-filled with BayCurrent Consulting's historical and projected data for accurate analysis.
- Customizable Template: Effortlessly adjust key inputs such as revenue growth, WACC, and EBITDA %.
- Instant Calculations: Watch the intrinsic value of BayCurrent Consulting update in real-time as you make adjustments.
- Expert Valuation Tool: Crafted for investors, analysts, and consultants in search of reliable DCF outcomes.
- Intuitive Design: Streamlined layout and straightforward instructions suitable for all skill levels.
Key Features
- Comprehensive BCC Data: Pre-loaded with BayCurrent Consulting's historical performance metrics and future projections.
- Flexible Input Options: Modify parameters such as revenue growth, profit margins, discount rates, tax obligations, and capital investments.
- Adaptive Valuation Model: Instantly recalculates Net Present Value (NPV) and intrinsic value as you adjust inputs.
- Scenario Analysis: Develop various forecast scenarios to evaluate different potential valuation results.
- Intuitive Interface: Designed for ease of use, catering to both seasoned professionals and newcomers.
How It Functions
- Download: Get the pre-prepared Excel template featuring BayCurrent Consulting, Inc.'s (6532T) financial metrics.
- Customize: Tailor projections by modifying parameters like revenue growth, EBITDA margin, and WACC.
- Real-Time Updates: Watch as intrinsic value and NPV calculations refresh automatically.
- Scenario Testing: Develop various projections and instantly evaluate different outcomes.
- Informed Decisions: Leverage the valuation findings to inform your investment approach.
Why Opt for BayCurrent Consulting, Inc. ([6532T])?
- Reliable Insights: Leverage accurate financial data for trustworthy evaluation outcomes.
- Flexible Customization: Tailor essential factors such as growth projections, discount rates, and tax considerations to suit your analysis.
- Efficiency Boost: Ready-to-use calculations save you the hassle of starting from the ground up.
- Expert-Level Resource: Crafted for the needs of investors, analysts, and consultants.
- Accessible Interface: User-friendly design and clear, step-by-step guidance ensure ease of use for everyone.
Who Can Benefit from BayCurrent Consulting, Inc. (6532T)?
- Investors: Evaluate BayCurrent's valuation prior to making investment decisions.
- Chief Financial Officers and Analysts: Optimize valuation workflows and validate forecasts.
- Entrepreneurs: Understand valuation methodologies employed by established firms like BayCurrent.
- Consultants: Provide comprehensive valuation assessments for your clients’ needs.
- Students and Instructors: Utilize real-time data to learn and teach valuation practices.
Contents of the Template
- Detailed DCF Model: Editable framework featuring in-depth valuation computations.
- Real-World Data: BayCurrent Consulting's (6532T) historical and projected financial information preloaded for analysis.
- Flexible Parameters: Modify WACC, growth rates, and tax assumptions to explore various scenarios.
- Financial Statements: Comprehensive annual and quarterly breakdowns for enhanced insights.
- Key Ratios: Integrated analysis for assessing profitability, efficiency, and leverage.
- User-Friendly Dashboard: Visual outputs including charts and tables for clear and actionable insights.
Disclaimer
All information, articles, and product details provided on this website are for general informational and educational purposes only. We do not claim any ownership over, nor do we intend to infringe upon, any trademarks, copyrights, logos, brand names, or other intellectual property mentioned or depicted on this site. Such intellectual property remains the property of its respective owners, and any references here are made solely for identification or informational purposes, without implying any affiliation, endorsement, or partnership.
We make no representations or warranties, express or implied, regarding the accuracy, completeness, or suitability of any content or products presented. Nothing on this website should be construed as legal, tax, investment, financial, medical, or other professional advice. In addition, no part of this site—including articles or product references—constitutes a solicitation, recommendation, endorsement, advertisement, or offer to buy or sell any securities, franchises, or other financial instruments, particularly in jurisdictions where such activity would be unlawful.
All content is of a general nature and may not address the specific circumstances of any individual or entity. It is not a substitute for professional advice or services. Any actions you take based on the information provided here are strictly at your own risk. You accept full responsibility for any decisions or outcomes arising from your use of this website and agree to release us from any liability in connection with your use of, or reliance upon, the content or products found herein.