
|
Mabuchi Motor Co., Ltd. (6592.T) Avaliação DCF |
Totalmente Editável: Adapte-Se Às Suas Necessidades No Excel Ou Planilhas
Design Profissional: Modelos Confiáveis E Padrão Da Indústria
Pré-Construídos Para Uso Rápido E Eficiente
Compatível com MAC/PC, totalmente desbloqueado
Não É Necessária Experiência; Fácil De Seguir
Mabuchi Motor Co., Ltd. (6592.T) Bundle
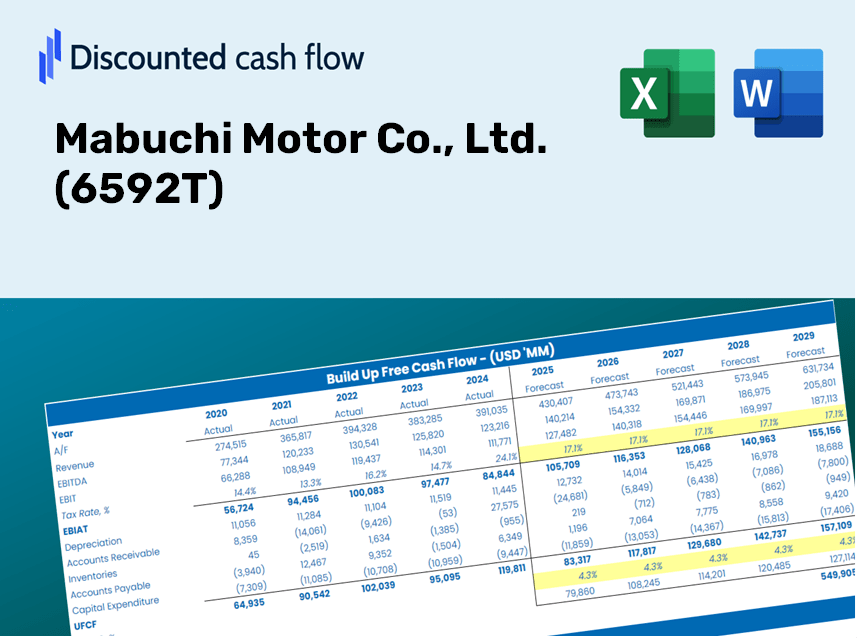
Explore o futuro financeiro da Mabuchi Motor Co., Ltd. (6592T) com nossa calculadora DCF amigável! Digite suas projeções de crescimento, margens e despesas para calcular o valor intrínseco da Mabuchi Motor Co., Ltd. (6592T) e refine sua abordagem de investimento.
Discounted Cash Flow (DCF) - (USD MM)
| Year | AY1 2020 |
AY2 2021 |
AY3 2022 |
AY4 2023 |
AY5 2024 |
FY1 2025 |
FY2 2026 |
FY3 2027 |
FY4 2028 |
FY5 2029 |
|---|---|---|---|---|---|---|---|---|---|---|
| Revenue | 116,432.0 | 134,595.0 | 156,706.0 | 178,663.0 | 196,212.0 | 223,613.7 | 254,842.2 | 290,431.8 | 330,991.7 | 377,215.9 |
| Revenue Growth, % | 0 | 15.6 | 16.43 | 14.01 | 9.82 | 13.97 | 13.97 | 13.97 | 13.97 | 13.97 |
| EBITDA | 21,840.0 | 30,126.0 | 32,887.0 | 28,187.0 | 35,603.0 | 42,955.6 | 48,954.5 | 55,791.2 | 63,582.6 | 72,462.2 |
| EBITDA, % | 18.76 | 22.38 | 20.99 | 15.78 | 18.15 | 19.21 | 19.21 | 19.21 | 19.21 | 19.21 |
| Depreciation | 8,939.0 | 10,024.0 | 12,122.0 | 12,832.0 | 14,208.0 | 16,674.4 | 19,003.0 | 21,656.8 | 24,681.3 | 28,128.1 |
| Depreciation, % | 7.68 | 7.45 | 7.74 | 7.18 | 7.24 | 7.46 | 7.46 | 7.46 | 7.46 | 7.46 |
| EBIT | 12,901.0 | 20,102.0 | 20,765.0 | 15,355.0 | 21,395.0 | 26,281.2 | 29,951.5 | 34,134.3 | 38,901.3 | 44,334.0 |
| EBIT, % | 11.08 | 14.94 | 13.25 | 8.59 | 10.9 | 11.75 | 11.75 | 11.75 | 11.75 | 11.75 |
| Total Cash | 111,518.0 | 105,501.0 | 103,112.0 | 116,604.0 | 134,944.0 | 167,264.2 | 190,623.3 | 217,244.5 | 247,583.5 | 282,159.4 |
| Total Cash, percent | .0 | .0 | .0 | .0 | .0 | .0 | .0 | .0 | .0 | .0 |
| Account Receivables | 24,566.0 | 23,875.0 | 28,743.0 | 33,804.0 | 37,256.0 | 42,525.8 | 48,464.6 | 55,232.9 | 62,946.4 | 71,737.1 |
| Account Receivables, % | 21.1 | 17.74 | 18.34 | 18.92 | 18.99 | 19.02 | 19.02 | 19.02 | 19.02 | 19.02 |
| Inventories | 32,518.0 | 50,919.0 | 61,392.0 | 60,449.0 | 59,805.0 | 75,693.4 | 86,264.3 | 98,311.4 | 112,041.0 | 127,687.9 |
| Inventories, % | 27.93 | 37.83 | 39.18 | 33.83 | 30.48 | 33.85 | 33.85 | 33.85 | 33.85 | 33.85 |
| Accounts Payable | 6,486.0 | 7,442.0 | 7,989.0 | 8,865.0 | 7,692.0 | 11,216.5 | 12,782.9 | 14,568.1 | 16,602.5 | 18,921.1 |
| Accounts Payable, % | 5.57 | 5.53 | 5.1 | 4.96 | 3.92 | 5.02 | 5.02 | 5.02 | 5.02 | 5.02 |
| Capital Expenditure | -7,736.0 | -9,622.0 | -10,473.0 | -13,006.0 | -14,067.0 | -15,619.5 | -17,800.8 | -20,286.8 | -23,119.9 | -26,348.7 |
| Capital Expenditure, % | -6.64 | -7.15 | -6.68 | -7.28 | -7.17 | -6.99 | -6.99 | -6.99 | -6.99 | -6.99 |
| Tax Rate, % | 45.9 | 45.9 | 45.9 | 45.9 | 45.9 | 45.9 | 45.9 | 45.9 | 45.9 | 45.9 |
| EBITAT | 8,340.5 | 14,251.0 | 14,295.7 | 10,947.9 | 11,574.3 | 17,334.3 | 19,755.1 | 22,514.0 | 25,658.2 | 29,241.4 |
| Depreciation | ||||||||||
| Changes in Account Receivables | ||||||||||
| Changes in Inventories | ||||||||||
| Changes in Accounts Payable | ||||||||||
| Capital Expenditure | ||||||||||
| UFCF | -41,054.5 | -2,101.0 | 1,150.7 | 7,531.9 | 7,734.3 | 755.4 | 6,014.0 | 6,853.8 | 7,811.0 | 8,901.8 |
| WACC, % | 5.16 | 5.16 | 5.16 | 5.16 | 5.15 | 5.16 | 5.16 | 5.16 | 5.16 | 5.16 |
| PV UFCF | ||||||||||
| SUM PV UFCF | 25,361.9 | |||||||||
| Long Term Growth Rate, % | 2.00 | |||||||||
| Free cash flow (T + 1) | 9,080 | |||||||||
| Terminal Value | 287,613 | |||||||||
| Present Terminal Value | 223,675 | |||||||||
| Enterprise Value | 249,037 | |||||||||
| Net Debt | -130,050 | |||||||||
| Equity Value | 379,087 | |||||||||
| Diluted Shares Outstanding, MM | 127 | |||||||||
| Equity Value Per Share | 2,983.41 |
What You Will Receive
- Pre-Filled Financial Model: Leverage Mabuchi Motor's actual data for accurate DCF valuation.
- Comprehensive Forecast Control: Modify revenue growth, profit margins, WACC, and other crucial parameters.
- Real-Time Calculations: Automatic updates keep you informed of results as you adjust inputs.
- Professional-Grade Template: A polished Excel file crafted for high-quality valuation presentations.
- Flexible and Reusable: Designed for adaptability, enabling multiple uses for in-depth forecasting.
Key Features
- Real-Life Mabuchi Data: Pre-filled with Mabuchi Motor’s historical financials and future projections.
- Fully Customizable Inputs: Modify revenue growth rates, profit margins, discount rates, tax rates, and capital expenditures.
- Dynamic Valuation Model: Automatically updates Net Present Value (NPV) and intrinsic value based on your adjustments.
- Scenario Testing: Develop multiple forecasting scenarios to evaluate various valuation results.
- User-Friendly Design: Intuitive, organized layout catering to both professionals and newcomers.
How It Works
- Step 1: Download the Excel file.
- Step 2: Review pre-entered Mabuchi Motor Co., Ltd. (6592T) data (historical and projected).
- Step 3: Modify key assumptions (yellow cells) based on your insights.
- Step 4: Observe automatic recalculations for Mabuchi Motor Co., Ltd.'s intrinsic value.
- Step 5: Utilize the results for investment decisions or reporting purposes.
Why Choose This Calculator for Mabuchi Motor Co., Ltd. (6592T)?
- User-Friendly Design: Tailored for both newcomers and seasoned professionals.
- Customizable Inputs: Adjust parameters effortlessly to suit your analysis needs.
- Real-Time Results: Witness immediate updates to Mabuchi Motor’s valuation as you modify inputs.
- Pre-Configured Data: Comes with Mabuchi Motor’s latest financial information for swift assessments.
- Preferred by Industry Experts: A valuable tool for investors and analysts seeking to make informed choices.
Who Should Consider Mabuchi Motor Co., Ltd. (6592T)?
- Investors: Make informed investment choices with insights from a leading manufacturer in the motor industry.
- Market Analysts: Utilize comprehensive data and analytics to evaluate market trends and forecasts.
- Business Consultants: Tailor presentations and strategies using detailed reports on Mabuchi Motor's performance.
- Technology Enthusiasts: Explore innovative motor solutions and their applications in various industries.
- Students and Educators: Leverage real-world case studies for deeper learning in business and engineering courses.
Contents of the Template
- Preloaded 6592T Data: Historical and projected financial metrics, including revenue, EBIT, and capital expenditures.
- DCF and WACC Models: Advanced spreadsheets for calculating intrinsic value and Weighted Average Cost of Capital.
- Editable Inputs: Cells highlighted in yellow for modifying revenue growth, tax rates, and discount rates.
- Financial Statements: Detailed annual and quarterly financial reports for in-depth analysis.
- Key Ratios: Metrics for profitability, leverage, and efficiency to assess performance.
- Dashboard and Charts: Visual representations of valuation results and underlying assumptions.
Disclaimer
All information, articles, and product details provided on this website are for general informational and educational purposes only. We do not claim any ownership over, nor do we intend to infringe upon, any trademarks, copyrights, logos, brand names, or other intellectual property mentioned or depicted on this site. Such intellectual property remains the property of its respective owners, and any references here are made solely for identification or informational purposes, without implying any affiliation, endorsement, or partnership.
We make no representations or warranties, express or implied, regarding the accuracy, completeness, or suitability of any content or products presented. Nothing on this website should be construed as legal, tax, investment, financial, medical, or other professional advice. In addition, no part of this site—including articles or product references—constitutes a solicitation, recommendation, endorsement, advertisement, or offer to buy or sell any securities, franchises, or other financial instruments, particularly in jurisdictions where such activity would be unlawful.
All content is of a general nature and may not address the specific circumstances of any individual or entity. It is not a substitute for professional advice or services. Any actions you take based on the information provided here are strictly at your own risk. You accept full responsibility for any decisions or outcomes arising from your use of this website and agree to release us from any liability in connection with your use of, or reliance upon, the content or products found herein.