
|
Daihen Corporation (6622.T) Avaliação DCF |
Totalmente Editável: Adapte-Se Às Suas Necessidades No Excel Ou Planilhas
Design Profissional: Modelos Confiáveis E Padrão Da Indústria
Pré-Construídos Para Uso Rápido E Eficiente
Compatível com MAC/PC, totalmente desbloqueado
Não É Necessária Experiência; Fácil De Seguir
DAIHEN Corporation (6622.T) Bundle
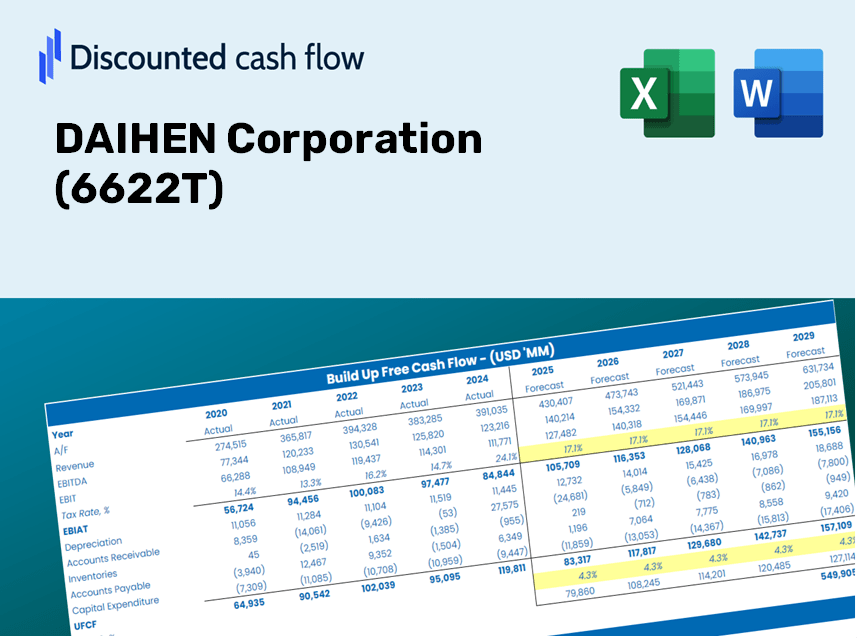
Procurando determinar o valor intrínseco da Daihen Corporation? Nossa calculadora DCF (6622T) integra dados do mundo real com recursos abrangentes de personalização, permitindo ajustar as previsões e aprimorar suas decisões de investimento.
Discounted Cash Flow (DCF) - (USD MM)
| Year | AY1 2020 |
AY2 2021 |
AY3 2022 |
AY4 2023 |
AY5 2024 |
FY1 2025 |
FY2 2026 |
FY3 2027 |
FY4 2028 |
FY5 2029 |
|---|---|---|---|---|---|---|---|---|---|---|
| Revenue | 145,144.0 | 160,618.0 | 185,288.0 | 188,571.0 | 226,375.0 | 253,449.5 | 283,762.0 | 317,700.0 | 355,696.9 | 398,238.3 |
| Revenue Growth, % | 0 | 10.66 | 15.36 | 1.77 | 20.05 | 11.96 | 11.96 | 11.96 | 11.96 | 11.96 |
| EBITDA | 17,305.0 | 20,770.0 | 23,266.0 | 27,023.0 | 25,299.0 | 31,892.4 | 35,706.8 | 39,977.3 | 44,758.6 | 50,111.7 |
| EBITDA, % | 11.92 | 12.93 | 12.56 | 14.33 | 11.18 | 12.58 | 12.58 | 12.58 | 12.58 | 12.58 |
| Depreciation | 5,121.0 | 5,036.0 | 5,069.0 | 5,324.0 | 6,565.0 | 7,665.7 | 8,582.5 | 9,609.0 | 10,758.2 | 12,044.9 |
| Depreciation, % | 3.53 | 3.14 | 2.74 | 2.82 | 2.9 | 3.02 | 3.02 | 3.02 | 3.02 | 3.02 |
| EBIT | 12,184.0 | 15,734.0 | 18,197.0 | 21,699.0 | 18,734.0 | 24,226.7 | 27,124.2 | 30,368.3 | 34,000.3 | 38,066.8 |
| EBIT, % | 8.39 | 9.8 | 9.82 | 11.51 | 8.28 | 9.56 | 9.56 | 9.56 | 9.56 | 9.56 |
| Total Cash | 19,261.0 | 24,822.0 | 15,265.0 | 23,327.0 | 30,354.0 | 31,803.8 | 35,607.6 | 39,866.3 | 44,634.3 | 49,972.5 |
| Total Cash, percent | .0 | .0 | .0 | .0 | .0 | .0 | .0 | .0 | .0 | .0 |
| Account Receivables | 40,375.0 | 36,539.0 | 44,320.0 | 56,961.0 | 54,222.0 | 65,209.8 | 73,009.0 | 81,740.8 | 91,517.0 | 102,462.5 |
| Account Receivables, % | 27.82 | 22.75 | 23.92 | 30.21 | 23.95 | 25.73 | 25.73 | 25.73 | 25.73 | 25.73 |
| Inventories | 41,781.0 | 60,448.0 | 78,634.0 | 99,012.0 | 101,707.0 | 104,570.4 | 117,077.0 | 131,079.4 | 146,756.5 | 164,308.6 |
| Inventories, % | 28.79 | 37.63 | 42.44 | 52.51 | 44.93 | 41.26 | 41.26 | 41.26 | 41.26 | 41.26 |
| Accounts Payable | 15,472.0 | 39,325.0 | 39,256.0 | 20,040.0 | 36,845.0 | 42,190.8 | 47,236.8 | 52,886.4 | 59,211.6 | 66,293.3 |
| Accounts Payable, % | 10.66 | 24.48 | 21.19 | 10.63 | 16.28 | 16.65 | 16.65 | 16.65 | 16.65 | 16.65 |
| Capital Expenditure | -3,622.0 | -4,004.0 | -5,193.0 | -7,481.0 | -7,950.0 | -7,740.4 | -8,666.1 | -9,702.6 | -10,863.0 | -12,162.2 |
| Capital Expenditure, % | -2.5 | -2.49 | -2.8 | -3.97 | -3.51 | -3.05 | -3.05 | -3.05 | -3.05 | -3.05 |
| Tax Rate, % | 32.93 | 32.93 | 32.93 | 32.93 | 32.93 | 32.93 | 32.93 | 32.93 | 32.93 | 32.93 |
| EBITAT | 8,736.3 | 11,184.0 | 13,423.9 | 16,899.8 | 12,565.3 | 17,516.4 | 19,611.3 | 21,956.9 | 24,582.9 | 27,523.0 |
| Depreciation | ||||||||||
| Changes in Account Receivables | ||||||||||
| Changes in Inventories | ||||||||||
| Changes in Accounts Payable | ||||||||||
| Capital Expenditure | ||||||||||
| UFCF | -56,448.7 | 21,238.0 | -12,736.1 | -37,492.2 | 28,029.3 | 8,936.3 | 4,268.0 | 4,778.5 | 5,350.0 | 5,989.9 |
| WACC, % | 5.89 | 5.88 | 5.9 | 5.94 | 5.85 | 5.89 | 5.89 | 5.89 | 5.89 | 5.89 |
| PV UFCF | ||||||||||
| SUM PV UFCF | 25,023.6 | |||||||||
| Long Term Growth Rate, % | 2.00 | |||||||||
| Free cash flow (T + 1) | 6,110 | |||||||||
| Terminal Value | 156,981 | |||||||||
| Present Terminal Value | 117,905 | |||||||||
| Enterprise Value | 142,928 | |||||||||
| Net Debt | 38,590 | |||||||||
| Equity Value | 104,338 | |||||||||
| Diluted Shares Outstanding, MM | 24 | |||||||||
| Equity Value Per Share | 4,303.15 |
What You Will Receive
- Adjustable Forecast Inputs: Easily modify key assumptions (growth %, margins, WACC) to explore various scenarios.
- Real-World Data: DAIHEN Corporation’s financial data pre-filled to kickstart your analysis.
- Automatic DCF Outputs: The template computes Net Present Value (NPV) and intrinsic value on your behalf.
- Customizable and Professional: A refined Excel model tailored to your valuation requirements.
- Designed for Analysts and Investors: Perfect for evaluating projections, assessing strategies, and enhancing efficiency.
Key Features
- Pre-Loaded Data: DAIHEN Corporation’s historical financial statements and pre-filled projections.
- Fully Adjustable Inputs: Modify WACC, tax rates, revenue growth, and EBITDA margins as needed.
- Instant Results: Watch DAIHEN Corporation’s intrinsic value update in real time.
- Clear Visual Outputs: Dashboard charts showcase valuation results and essential metrics.
- Built for Accuracy: A professional tool designed for analysts, investors, and finance specialists.
How It Operates
- 1. Access the Template: Download and open the Excel file containing DAIHEN Corporation's (6622T) preloaded data.
- 2. Modify Assumptions: Adjust essential inputs such as growth rates, WACC, and capital expenditures.
- 3. View Results in Real-Time: The DCF model automatically calculates intrinsic value and NPV for your analysis.
- 4. Explore Various Scenarios: Evaluate multiple projections to understand different valuation results.
- 5. Present with Assurance: Share expert valuation findings to bolster your decision-making process.
Why Choose the DAIHEN Corporation ([6622T]) Calculator?
- Precision: Utilizes real DAIHEN Corporation financial data for reliable results.
- Versatility: Crafted to allow users to effortlessly test and adjust inputs.
- Efficiency: Avoid the complexities of creating a DCF model from the ground up.
- High-Quality: Built with the accuracy and functionality expected by CFOs.
- Intuitive: Designed for simplicity, making it accessible for users without deep financial modeling expertise.
Who Can Benefit from DAIHEN Corporation's Offerings?
- Investors: Empower your investment choices with DAIHEN's advanced valuation tools.
- Financial Analysts: Enhance efficiency with a customizable DCF model tailored for DAIHEN's operations.
- Consultants: Seamlessly modify templates for client presentations or analytical reports concerning DAIHEN.
- Finance Enthusiasts: Broaden your comprehension of valuation strategies through practical examples related to DAIHEN.
- Educators and Students: Utilize these resources as effective teaching aids in finance courses focusing on DAIHEN (6622T).
Contents of the Template
- Operating and Balance Sheet Data: Comprehensive historical data and forecasts for DAIHEN Corporation (6622T), featuring revenue, EBITDA, EBIT, and capital expenditure figures.
- WACC Calculation: A specialized sheet for the Weighted Average Cost of Capital (WACC), detailing essential parameters such as Beta, risk-free rate, and share price.
- DCF Valuation (Unlevered and Levered): Customizable Discounted Cash Flow models that compute intrinsic value with thorough calculations provided.
- Financial Statements: Pre-populated financial statements (annual and quarterly) available to facilitate in-depth analysis.
- Key Ratios: A collection of key ratios for DAIHEN Corporation (6622T), including profitability, leverage, and efficiency metrics.
- Dashboard and Charts: An illustrative summary of valuation outputs and assumptions designed for easy result analysis.
Disclaimer
All information, articles, and product details provided on this website are for general informational and educational purposes only. We do not claim any ownership over, nor do we intend to infringe upon, any trademarks, copyrights, logos, brand names, or other intellectual property mentioned or depicted on this site. Such intellectual property remains the property of its respective owners, and any references here are made solely for identification or informational purposes, without implying any affiliation, endorsement, or partnership.
We make no representations or warranties, express or implied, regarding the accuracy, completeness, or suitability of any content or products presented. Nothing on this website should be construed as legal, tax, investment, financial, medical, or other professional advice. In addition, no part of this site—including articles or product references—constitutes a solicitation, recommendation, endorsement, advertisement, or offer to buy or sell any securities, franchises, or other financial instruments, particularly in jurisdictions where such activity would be unlawful.
All content is of a general nature and may not address the specific circumstances of any individual or entity. It is not a substitute for professional advice or services. Any actions you take based on the information provided here are strictly at your own risk. You accept full responsibility for any decisions or outcomes arising from your use of this website and agree to release us from any liability in connection with your use of, or reliance upon, the content or products found herein.