
|
Omron Corporation (6645.T) Avaliação DCF |
Totalmente Editável: Adapte-Se Às Suas Necessidades No Excel Ou Planilhas
Design Profissional: Modelos Confiáveis E Padrão Da Indústria
Pré-Construídos Para Uso Rápido E Eficiente
Compatível com MAC/PC, totalmente desbloqueado
Não É Necessária Experiência; Fácil De Seguir
OMRON Corporation (6645.T) Bundle
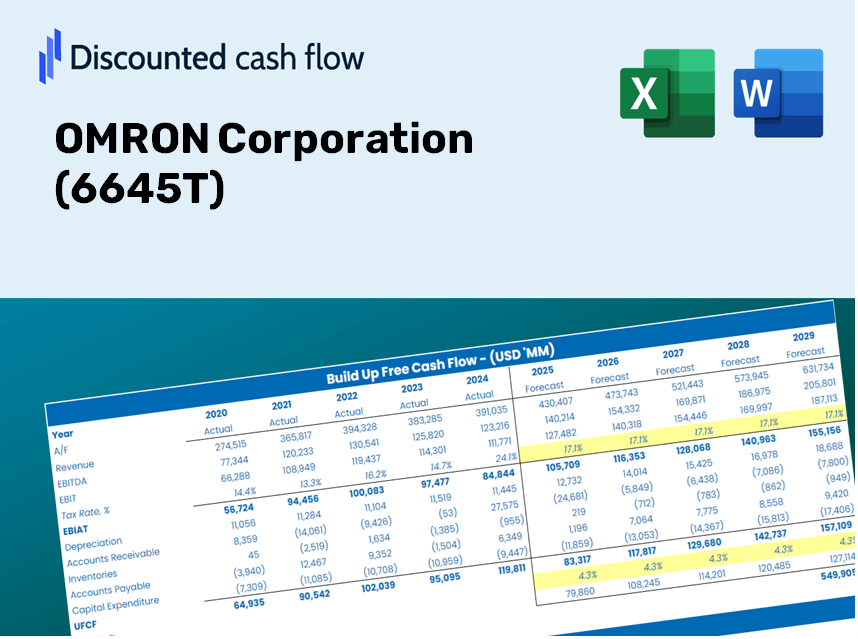
Seja você um investidor ou analista, esta calculadora DCF da Omron Corporation (6645T) é sua ferramenta preferida para uma avaliação precisa. Com dados reais da Omron Corporation já carregados, você pode ajustar as previsões e observar instantaneamente os efeitos.
Discounted Cash Flow (DCF) - (USD MM)
| Year | AY1 2021 |
AY2 2022 |
AY3 2023 |
AY4 2024 |
AY5 2025 |
FY1 2026 |
FY2 2027 |
FY3 2028 |
FY4 2029 |
FY5 2030 |
|---|---|---|---|---|---|---|---|---|---|---|
| Revenue | 655,529.0 | 762,927.0 | 876,082.0 | 818,761.0 | 801,753.0 | 847,041.9 | 894,889.0 | 945,439.0 | 998,844.3 | 1,055,266.3 |
| Revenue Growth, % | 0 | 16.38 | 14.83 | -6.54 | -2.08 | 5.65 | 5.65 | 5.65 | 5.65 | 5.65 |
| EBITDA | 87,845.0 | 110,081.0 | 124,996.0 | 65,769.0 | 62,451.0 | 98,119.8 | 103,662.3 | 109,517.9 | 115,704.3 | 122,240.1 |
| EBITDA, % | 13.4 | 14.43 | 14.27 | 8.03 | 7.79 | 11.58 | 11.58 | 11.58 | 11.58 | 11.58 |
| Depreciation | 22,756.0 | 23,367.0 | 26,587.0 | 30,816.0 | 33,450.0 | 29,654.6 | 31,329.7 | 33,099.5 | 34,969.2 | 36,944.5 |
| Depreciation, % | 3.47 | 3.06 | 3.03 | 3.76 | 4.17 | 3.5 | 3.5 | 3.5 | 3.5 | 3.5 |
| EBIT | 65,089.0 | 86,714.0 | 98,409.0 | 34,953.0 | 29,001.0 | 68,465.1 | 72,332.6 | 76,418.4 | 80,735.1 | 85,295.6 |
| EBIT, % | 9.93 | 11.37 | 11.23 | 4.27 | 3.62 | 8.08 | 8.08 | 8.08 | 8.08 | 8.08 |
| Total Cash | 250,755.0 | 155,484.0 | 105,279.0 | 143,086.0 | 149,023.0 | 180,779.6 | 190,991.4 | 201,780.0 | 213,178.0 | 225,219.9 |
| Total Cash, percent | .0 | .0 | .0 | .0 | .0 | .0 | .0 | .0 | .0 | .0 |
| Account Receivables | 134,405.0 | 151,022.0 | 179,205.0 | 171,210.0 | 172,967.0 | 174,894.0 | 184,773.3 | 195,210.7 | 206,237.6 | 217,887.4 |
| Account Receivables, % | 20.5 | 19.8 | 20.46 | 20.91 | 21.57 | 20.65 | 20.65 | 20.65 | 20.65 | 20.65 |
| Inventories | 103,265.0 | 141,935.0 | 173,926.0 | 174,034.0 | 172,953.0 | 164,389.3 | 173,675.2 | 183,485.6 | 193,850.3 | 204,800.3 |
| Inventories, % | 15.75 | 18.6 | 19.85 | 21.26 | 21.57 | 19.41 | 19.41 | 19.41 | 19.41 | 19.41 |
| Accounts Payable | 69,561.0 | 86,827.0 | 92,855.0 | 82,548.0 | 91,620.0 | 91,651.0 | 96,828.1 | 102,297.7 | 108,076.2 | 114,181.1 |
| Accounts Payable, % | 10.61 | 11.38 | 10.6 | 10.08 | 11.43 | 10.82 | 10.82 | 10.82 | 10.82 | 10.82 |
| Capital Expenditure | -26,662.0 | -33,357.0 | -45,018.0 | -45,378.0 | -48,993.0 | -42,743.5 | -45,158.0 | -47,708.9 | -50,403.8 | -53,251.0 |
| Capital Expenditure, % | -4.07 | -4.37 | -5.14 | -5.54 | -6.11 | -5.05 | -5.05 | -5.05 | -5.05 | -5.05 |
| Tax Rate, % | 43.9 | 43.9 | 43.9 | 43.9 | 43.9 | 43.9 | 43.9 | 43.9 | 43.9 | 43.9 |
| EBITAT | 47,783.7 | 62,571.9 | 73,059.9 | 13,863.9 | 16,271.0 | 43,212.8 | 45,653.7 | 48,232.6 | 50,957.1 | 53,835.5 |
| Depreciation | ||||||||||
| Changes in Account Receivables | ||||||||||
| Changes in Inventories | ||||||||||
| Changes in Accounts Payable | ||||||||||
| Capital Expenditure | ||||||||||
| UFCF | -124,231.3 | 14,560.9 | 482.9 | -3,118.1 | 9,124.0 | 36,791.5 | 17,837.4 | 18,844.9 | 19,909.4 | 21,034.1 |
| WACC, % | 7.44 | 7.44 | 7.45 | 7.26 | 7.35 | 7.39 | 7.39 | 7.39 | 7.39 | 7.39 |
| PV UFCF | ||||||||||
| SUM PV UFCF | 94,643.8 | |||||||||
| Long Term Growth Rate, % | 2.00 | |||||||||
| Free cash flow (T + 1) | 21,455 | |||||||||
| Terminal Value | 398,210 | |||||||||
| Present Terminal Value | 278,828 | |||||||||
| Enterprise Value | 373,472 | |||||||||
| Net Debt | -4,709 | |||||||||
| Equity Value | 378,181 | |||||||||
| Diluted Shares Outstanding, MM | 197 | |||||||||
| Equity Value Per Share | 1,920.67 |
What You Will Receive
- Authentic OMRON Data: Preloaded financial metrics – including revenue and EBIT – derived from actual and projected figures.
- Comprehensive Customization: Modify all essential parameters (yellow cells) like WACC, growth %, and tax rates.
- Immediate Valuation Adjustments: Automatic recalculations to evaluate the effects of changes on OMRON's fair value.
- Flexible Excel Template: Designed for quick modifications, scenario analysis, and in-depth forecasting.
- Efficient and Precise: Bypass the need to create models from scratch while ensuring accuracy and adaptability.
Key Features
- Customizable Forecast Inputs: Adjust essential parameters such as revenue growth, EBITDA %, and capital investments.
- Instant DCF Valuation: Automatically computes intrinsic value, NPV, and related metrics in real-time.
- Precision-Driven Accuracy: Leverages OMRON’s real-world financial data for dependable valuation results.
- Streamlined Scenario Analysis: Effortlessly test various assumptions and evaluate outcomes side by side.
- Efficiency Boost: Remove the complexity of building intricate valuation models from the ground up.
How It Operates
- Download the Template: Obtain immediate access to the Excel-based OMRON DCF Calculator.
- Input Your Assumptions: Modify the yellow-highlighted cells for growth rates, WACC, margins, and additional parameters.
- Instant Calculations: The model will automatically calculate the intrinsic value of OMRON Corporation (6645T).
- Test Scenarios: Experiment with different assumptions to assess potential changes in valuation.
- Analyze and Decide: Leverage the results to inform your investment or financial analysis decisions.
Why Choose This Calculator for OMRON Corporation (6645T)?
- Designed for Experts: A sophisticated tool tailored for analysts, CFOs, and consultants.
- Accurate Data: OMRON’s historical and projected financials integrated for precision.
- Scenario Analysis: Effortlessly simulate various forecasts and assumptions.
- Comprehensive Outputs: Automatically computes intrinsic value, NPV, and essential metrics.
- User-Friendly: Step-by-step guidance to help you navigate the process effortlessly.
Who Should Utilize This Product?
- Investors: Accurately assess OMRON Corporation’s fair value prior to making investment choices.
- CFOs: Utilize a top-tier DCF model for comprehensive financial reporting and analysis.
- Consultants: Efficiently customize the template for client valuation reports.
- Entrepreneurs: Acquire knowledge about financial modeling practices employed by Fortune 500 firms.
- Educators: Implement it as a teaching resource to illustrate valuation techniques.
Contents of the Template
- Pre-Filled Data: Comprises OMRON Corporation's historical financial performance and projections.
- Discounted Cash Flow Model: An editable DCF valuation model with automatic computation features.
- Weighted Average Cost of Capital (WACC): A dedicated worksheet for calculating WACC using custom inputs.
- Key Financial Ratios: Evaluate OMRON's profitability, operational efficiency, and financial leverage.
- Customizable Inputs: Easily modify revenue growth rates, profit margins, and tax assumptions.
- Comprehensive Dashboard: Visuals and tables that present a summary of key valuation outcomes.
Disclaimer
All information, articles, and product details provided on this website are for general informational and educational purposes only. We do not claim any ownership over, nor do we intend to infringe upon, any trademarks, copyrights, logos, brand names, or other intellectual property mentioned or depicted on this site. Such intellectual property remains the property of its respective owners, and any references here are made solely for identification or informational purposes, without implying any affiliation, endorsement, or partnership.
We make no representations or warranties, express or implied, regarding the accuracy, completeness, or suitability of any content or products presented. Nothing on this website should be construed as legal, tax, investment, financial, medical, or other professional advice. In addition, no part of this site—including articles or product references—constitutes a solicitation, recommendation, endorsement, advertisement, or offer to buy or sell any securities, franchises, or other financial instruments, particularly in jurisdictions where such activity would be unlawful.
All content is of a general nature and may not address the specific circumstances of any individual or entity. It is not a substitute for professional advice or services. Any actions you take based on the information provided here are strictly at your own risk. You accept full responsibility for any decisions or outcomes arising from your use of this website and agree to release us from any liability in connection with your use of, or reliance upon, the content or products found herein.