
|
Nihon Kohden Corporation (6849.T) Avaliação DCF |
Totalmente Editável: Adapte-Se Às Suas Necessidades No Excel Ou Planilhas
Design Profissional: Modelos Confiáveis E Padrão Da Indústria
Pré-Construídos Para Uso Rápido E Eficiente
Compatível com MAC/PC, totalmente desbloqueado
Não É Necessária Experiência; Fácil De Seguir
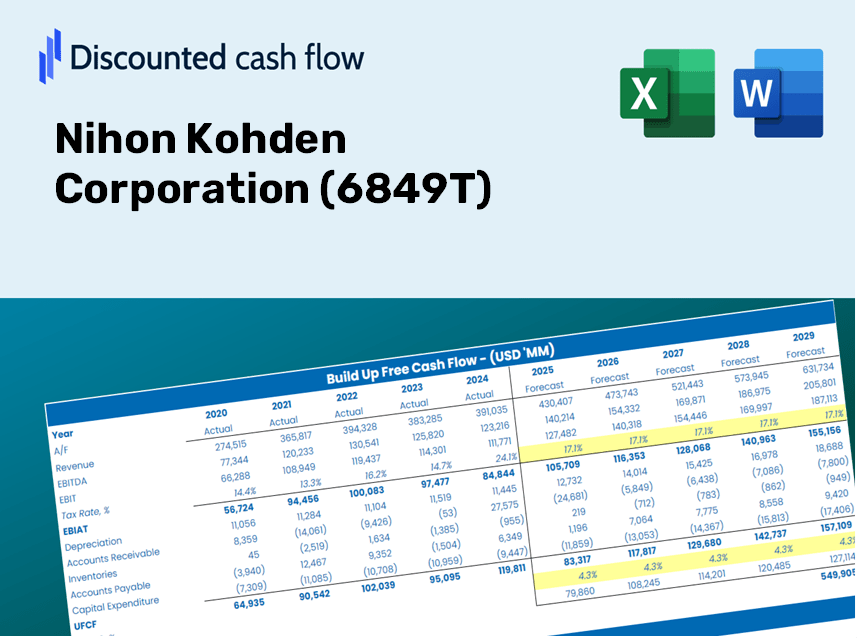
Nihon Kohden Corporation (6849.T) Bundle
Procurando determinar o valor intrínseco da Nihon Kohden Corporation? Nossa calculadora DCF (6849T) integra dados do mundo real com extensos recursos de personalização, permitindo ajustar as previsões e aprimorar suas estratégias de investimento.
Discounted Cash Flow (DCF) - (USD MM)
| Year | AY1 2021 |
AY2 2022 |
AY3 2023 |
AY4 2024 |
AY5 2025 |
FY1 2026 |
FY2 2027 |
FY3 2028 |
FY4 2029 |
FY5 2030 |
|---|---|---|---|---|---|---|---|---|---|---|
| Revenue | 199,727.0 | 205,129.0 | 206,603.0 | 221,986.0 | 225,424.0 | 232,422.1 | 239,637.5 | 247,076.8 | 254,747.1 | 262,655.6 |
| Revenue Growth, % | 0 | 2.7 | 0.71857 | 7.45 | 1.55 | 3.1 | 3.1 | 3.1 | 3.1 | 3.1 |
| EBITDA | 31,639.0 | 37,764.0 | 28,517.0 | 33,246.0 | 25,907.0 | 34,641.6 | 35,717.0 | 36,825.8 | 37,969.0 | 39,147.8 |
| EBITDA, % | 15.84 | 18.41 | 13.8 | 14.98 | 11.49 | 14.9 | 14.9 | 14.9 | 14.9 | 14.9 |
| Depreciation | 4,543.0 | 3,490.0 | 3,791.0 | 3,853.0 | 4,190.0 | 4,372.0 | 4,507.7 | 4,647.7 | 4,792.0 | 4,940.7 |
| Depreciation, % | 2.27 | 1.7 | 1.83 | 1.74 | 1.86 | 1.88 | 1.88 | 1.88 | 1.88 | 1.88 |
| EBIT | 27,096.0 | 34,274.0 | 24,726.0 | 29,393.0 | 21,717.0 | 30,269.6 | 31,209.3 | 32,178.1 | 33,177.1 | 34,207.0 |
| EBIT, % | 13.57 | 16.71 | 11.97 | 13.24 | 9.63 | 13.02 | 13.02 | 13.02 | 13.02 | 13.02 |
| Total Cash | 44,609.0 | 60,925.0 | 44,459.0 | 50,432.0 | 43,428.0 | 53,707.4 | 55,374.7 | 57,093.7 | 58,866.2 | 60,693.6 |
| Total Cash, percent | .0 | .0 | .0 | .0 | .0 | .0 | .0 | .0 | .0 | .0 |
| Account Receivables | 68,387.0 | 58,173.0 | 64,825.0 | 71,247.0 | 70,680.0 | 73,178.4 | 75,450.1 | 77,792.4 | 80,207.4 | 82,697.4 |
| Account Receivables, % | 34.24 | 28.36 | 31.38 | 32.1 | 31.35 | 31.49 | 31.49 | 31.49 | 31.49 | 31.49 |
| Inventories | 38,885.0 | 48,366.0 | 58,788.0 | 57,786.0 | 56,173.0 | 56,921.2 | 58,688.3 | 60,510.2 | 62,388.7 | 64,325.5 |
| Inventories, % | 19.47 | 23.58 | 28.45 | 26.03 | 24.92 | 24.49 | 24.49 | 24.49 | 24.49 | 24.49 |
| Accounts Payable | 24,412.0 | 24,045.0 | 22,940.0 | 20,143.0 | 19,786.0 | 24,589.9 | 25,353.3 | 26,140.3 | 26,951.9 | 27,788.6 |
| Accounts Payable, % | 12.22 | 11.72 | 11.1 | 9.07 | 8.78 | 10.58 | 10.58 | 10.58 | 10.58 | 10.58 |
| Capital Expenditure | -3,384.0 | -2,934.0 | -8,256.0 | -4,786.0 | -7,126.0 | -5,781.7 | -5,961.1 | -6,146.2 | -6,337.0 | -6,533.7 |
| Capital Expenditure, % | -1.69 | -1.43 | -4 | -2.16 | -3.16 | -2.49 | -2.49 | -2.49 | -2.49 | -2.49 |
| Tax Rate, % | 34.64 | 34.64 | 34.64 | 34.64 | 34.64 | 34.64 | 34.64 | 34.64 | 34.64 | 34.64 |
| EBITAT | 18,196.0 | 23,442.5 | 17,116.9 | 17,039.9 | 14,194.1 | 19,863.5 | 20,480.1 | 21,115.9 | 21,771.4 | 22,447.3 |
| Depreciation | ||||||||||
| Changes in Account Receivables | ||||||||||
| Changes in Inventories | ||||||||||
| Changes in Accounts Payable | ||||||||||
| Capital Expenditure | ||||||||||
| UFCF | -63,505.0 | 24,364.5 | -5,527.1 | 7,889.9 | 13,081.1 | 20,011.2 | 15,751.2 | 16,240.2 | 16,744.4 | 17,264.2 |
| WACC, % | 4.83 | 4.83 | 4.84 | 4.8 | 4.83 | 4.83 | 4.83 | 4.83 | 4.83 | 4.83 |
| PV UFCF | ||||||||||
| SUM PV UFCF | 75,030.4 | |||||||||
| Long Term Growth Rate, % | 2.00 | |||||||||
| Free cash flow (T + 1) | 17,609 | |||||||||
| Terminal Value | 623,171 | |||||||||
| Present Terminal Value | 492,341 | |||||||||
| Enterprise Value | 567,372 | |||||||||
| Net Debt | -2,352 | |||||||||
| Equity Value | 569,724 | |||||||||
| Diluted Shares Outstanding, MM | 166 | |||||||||
| Equity Value Per Share | 3,429.82 |
Benefits You Will Receive
- Genuine Nihon Kohden Financials: Access historical and projected data for precise valuation.
- Customizable Parameters: Adjust WACC, tax rates, revenue growth, and capital expenditures as needed.
- Real-time Calculations: Intrinsic value and NPV are computed automatically.
- Scenario Evaluation: Analyze various scenarios to assess the future performance of Nihon Kohden Corporation (6849T).
- User-Friendly Design: Designed for industry experts while remaining approachable for newcomers.
Key Features
- Real-Time Nihon Kohden Data: Equipped with the company's historical financial performance and future projections.
- Comprehensive Customization: Modify inputs such as revenue growth, profit margins, WACC, tax rates, and capital expenditures.
- Dynamic Valuation Framework: Automatic recalculation of Net Present Value (NPV) and intrinsic value based on user-defined parameters.
- Scenario Analysis: Develop multiple forecast scenarios to evaluate various valuation possibilities.
- Intuitive User Interface: Designed for ease of use, catering to both industry veterans and newcomers.
How It Works
- 1. Access the Template: Download and open the Excel file containing Nihon Kohden Corporation's (6849T) preloaded data.
- 2. Adjust Assumptions: Modify key variables such as growth rates, WACC, and capital expenditures relevant to Nihon Kohden Corporation (6849T).
- 3. View Results in Real-Time: The DCF model automatically calculates intrinsic value and NPV based on your inputs.
- 4. Explore Scenarios: Evaluate various forecasts to understand different valuation scenarios for Nihon Kohden Corporation (6849T).
- 5. Present with Confidence: Deliver professional valuation insights to enhance your decision-making for Nihon Kohden Corporation (6849T).
Why Opt for Nihon Kohden's Solutions?
- Time Efficiency: Eliminate the hassle of starting from scratch – our tools are ready to implement.
- Enhanced Precision: Dependable data and methodologies minimize valuation errors.
- Completely Customizable: Adapt the model to suit your specific assumptions and forecasts.
- User-Friendly: Intuitive visuals and outputs make results straightforward to understand.
- Endorsed by Professionals: Crafted for experts who prioritize accuracy and ease of use.
Who Can Benefit from Nihon Kohden Corporation (6849T) Products?
- Healthcare Professionals: Enhance patient care with advanced medical technologies and devices.
- Biomedical Engineers: Leverage innovative solutions for designing and improving medical equipment.
- Clinical Researchers: Utilize cutting-edge tools for accurate data collection and analysis in studies.
- Healthcare Institutions: Streamline operations and improve patient outcomes with integrated systems.
- Students and Educators: Explore the latest advancements in medical technology as part of your learning experience.
Contents of the Template
- Detailed DCF Model: An editable template featuring thorough valuation calculations.
- Historical and Projected Data: Nihon Kohden Corporation’s (6849T) financials preloaded for comprehensive analysis.
- Adjustable Variables: Modify WACC, growth rates, and tax assumptions to explore various scenarios.
- Comprehensive Financial Statements: Annual and quarterly breakdowns for enhanced insights.
- Essential Ratios: Integrated analysis for assessing profitability, efficiency, and leverage.
- Visual Dashboard: Charts and tables to present clear, actionable results.
Disclaimer
All information, articles, and product details provided on this website are for general informational and educational purposes only. We do not claim any ownership over, nor do we intend to infringe upon, any trademarks, copyrights, logos, brand names, or other intellectual property mentioned or depicted on this site. Such intellectual property remains the property of its respective owners, and any references here are made solely for identification or informational purposes, without implying any affiliation, endorsement, or partnership.
We make no representations or warranties, express or implied, regarding the accuracy, completeness, or suitability of any content or products presented. Nothing on this website should be construed as legal, tax, investment, financial, medical, or other professional advice. In addition, no part of this site—including articles or product references—constitutes a solicitation, recommendation, endorsement, advertisement, or offer to buy or sell any securities, franchises, or other financial instruments, particularly in jurisdictions where such activity would be unlawful.
All content is of a general nature and may not address the specific circumstances of any individual or entity. It is not a substitute for professional advice or services. Any actions you take based on the information provided here are strictly at your own risk. You accept full responsibility for any decisions or outcomes arising from your use of this website and agree to release us from any liability in connection with your use of, or reliance upon, the content or products found herein.