
|
Zhejiang Hangke Technology Incorporated Company (688006.SS) Avaliação DCF |
Totalmente Editável: Adapte-Se Às Suas Necessidades No Excel Ou Planilhas
Design Profissional: Modelos Confiáveis E Padrão Da Indústria
Pré-Construídos Para Uso Rápido E Eficiente
Compatível com MAC/PC, totalmente desbloqueado
Não É Necessária Experiência; Fácil De Seguir
Zhejiang HangKe Technology Incorporated Company (688006.SS) Bundle
Explore as perspectivas financeiras da Zhejiang Hangke Technology Incorporated Company (688006Ss) com nossa calculadora DCF amigável! Digite suas suposições de crescimento, margens e despesas para determinar o valor intrínseco da empresa incorporada da Zhejiang Hangke Technology (688006Ss) e refine sua estratégia de investimento.
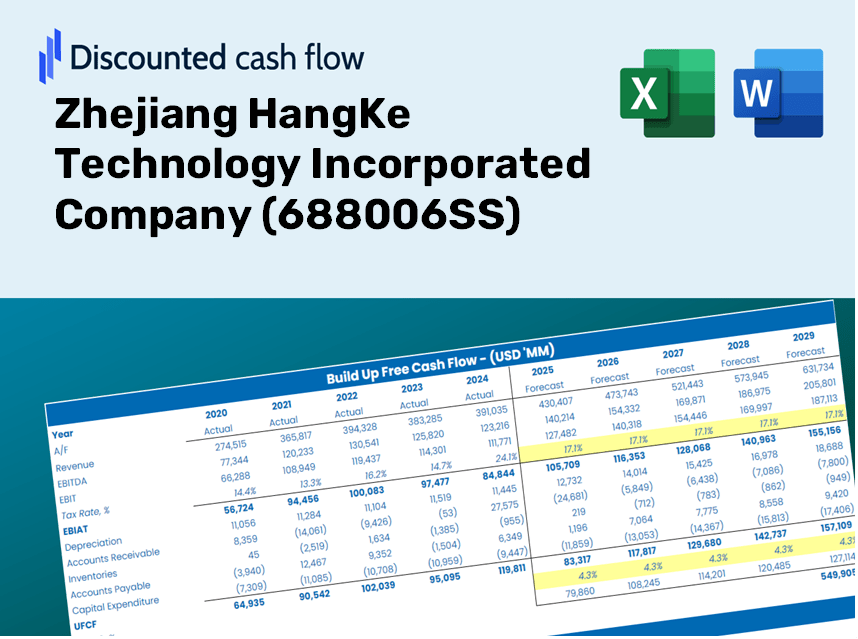
Discounted Cash Flow (DCF) - (USD MM)
| Year | AY1 2020 |
AY2 2021 |
AY3 2022 |
AY4 2023 |
AY5 2024 |
FY1 2025 |
FY2 2026 |
FY3 2027 |
FY4 2028 |
FY5 2029 |
|---|---|---|---|---|---|---|---|---|---|---|
| Revenue | 1,492.9 | 2,483.3 | 3,454.1 | 3,931.7 | 2,981.2 | 3,689.8 | 4,567.0 | 5,652.7 | 6,996.4 | 8,659.6 |
| Revenue Growth, % | 0 | 66.35 | 39.09 | 13.83 | -24.18 | 23.77 | 23.77 | 23.77 | 23.77 | 23.77 |
| EBITDA | 388.1 | 315.0 | 513.8 | 834.3 | 362.1 | 641.5 | 794.0 | 982.7 | 1,216.3 | 1,505.4 |
| EBITDA, % | 26 | 12.69 | 14.87 | 21.22 | 12.15 | 17.38 | 17.38 | 17.38 | 17.38 | 17.38 |
| Depreciation | 33.5 | 41.0 | 69.0 | 98.4 | 111.5 | 89.5 | 110.8 | 137.2 | 169.8 | 210.1 |
| Depreciation, % | 2.24 | 1.65 | 2 | 2.5 | 3.74 | 2.43 | 2.43 | 2.43 | 2.43 | 2.43 |
| EBIT | 354.7 | 274.0 | 444.8 | 735.9 | 250.6 | 551.9 | 683.1 | 845.5 | 1,046.5 | 1,295.3 |
| EBIT, % | 23.76 | 11.03 | 12.88 | 18.72 | 8.4 | 14.96 | 14.96 | 14.96 | 14.96 | 14.96 |
| Total Cash | 1,753.7 | 1,941.6 | 2,213.5 | 3,269.1 | 3,075.1 | 3,139.4 | 3,885.7 | 4,809.4 | 5,952.7 | 7,367.8 |
| Total Cash, percent | .0 | .0 | .0 | .0 | .0 | .0 | .0 | .0 | .0 | .0 |
| Account Receivables | 573.9 | 1,346.7 | 2,056.8 | 2,393.0 | 2,150.1 | 2,104.7 | 2,605.0 | 3,224.3 | 3,990.8 | 4,939.5 |
| Account Receivables, % | 38.44 | 54.23 | 59.55 | 60.86 | 72.12 | 57.04 | 57.04 | 57.04 | 57.04 | 57.04 |
| Inventories | 797.4 | 1,422.7 | 2,380.7 | 2,901.5 | 2,913.1 | 2,591.3 | 3,207.3 | 3,969.8 | 4,913.5 | 6,081.5 |
| Inventories, % | 53.42 | 57.29 | 68.92 | 73.8 | 97.72 | 70.23 | 70.23 | 70.23 | 70.23 | 70.23 |
| Accounts Payable | 589.0 | 1,933.6 | 2,913.5 | 1,562.6 | 1,077.9 | 2,048.4 | 2,535.3 | 3,138.0 | 3,884.0 | 4,807.3 |
| Accounts Payable, % | 39.46 | 77.86 | 84.35 | 39.74 | 36.16 | 55.51 | 55.51 | 55.51 | 55.51 | 55.51 |
| Capital Expenditure | -163.2 | -317.1 | -417.3 | -412.3 | -106.0 | -367.7 | -455.1 | -563.3 | -697.2 | -862.9 |
| Capital Expenditure, % | -10.93 | -12.77 | -12.08 | -10.49 | -3.56 | -9.96 | -9.96 | -9.96 | -9.96 | -9.96 |
| Tax Rate, % | 3.3 | 3.3 | 3.3 | 3.3 | 3.3 | 3.3 | 3.3 | 3.3 | 3.3 | 3.3 |
| EBITAT | 310.2 | 250.7 | 401.2 | 653.6 | 242.3 | 501.9 | 621.2 | 768.8 | 951.6 | 1,177.8 |
| Depreciation | ||||||||||
| Changes in Account Receivables | ||||||||||
| Changes in Inventories | ||||||||||
| Changes in Accounts Payable | ||||||||||
| Capital Expenditure | ||||||||||
| UFCF | -601.8 | -79.0 | -635.2 | -1,868.3 | -5.6 | 1,561.3 | -352.5 | -436.3 | -540.0 | -668.4 |
| WACC, % | 7.66 | 7.67 | 7.67 | 7.66 | 7.68 | 7.67 | 7.67 | 7.67 | 7.67 | 7.67 |
| PV UFCF | ||||||||||
| SUM PV UFCF | -67.3 | |||||||||
| Long Term Growth Rate, % | 4.00 | |||||||||
| Free cash flow (T + 1) | -695 | |||||||||
| Terminal Value | -18,952 | |||||||||
| Present Terminal Value | -13,098 | |||||||||
| Enterprise Value | -13,166 | |||||||||
| Net Debt | -2,172 | |||||||||
| Equity Value | -10,994 | |||||||||
| Diluted Shares Outstanding, MM | 604 | |||||||||
| Equity Value Per Share | -18.19 |
Benefits You Will Receive
- Customizable Excel Template: A fully adjustable Excel-based DCF Calculator featuring pre-loaded real financial data for Zhejiang HangKe Technology Incorporated (688006SS).
- Comprehensive Data: Access to historical performance data and forward-looking projections (highlighted in the yellow cells).
- Projection Flexibility: Modify forecast parameters such as revenue growth, EBITDA percentage, and WACC.
- Instant Calculations: Effortlessly observe how your inputs affect the valuation of Zhejiang HangKe Technology Incorporated (688006SS).
- Professional Resource: Designed for investors, CFOs, consultants, and financial analysts.
- User-Centric Design: Organized for simplicity and ease of navigation, complete with step-by-step guidance.
Key Features
- Accurate Financial Data for Zhejiang HangKe: Gain access to reliable historical data and future forecasts.
- Adjustable Forecast Parameters: Modify highlighted cells such as WACC, growth rates, and profit margins with ease.
- Real-Time Calculations: Enjoy automatic updates to DCF, Net Present Value (NPV), and cash flow analyses.
- Interactive Visual Dashboard: Utilize clear charts and summaries to better understand your valuation findings.
- Designed for All Levels: A user-friendly layout tailored for investors, CFOs, and consultants alike.
How It Functions
- Download: Obtain the ready-to-use Excel file featuring Zhejiang HangKe Technology (688006SS)'s financial data.
- Customize: Modify forecasts, including revenue growth, EBITDA %, and WACC based on your analysis.
- Update Automatically: The intrinsic value and NPV calculations refresh in real-time.
- Test Scenarios: Generate various projections and compare results instantly.
- Make Decisions: Utilize the valuation findings to inform your investment strategy.
Why Choose This Calculator for Zhejiang HangKe Technology Incorporated (688006SS)?
- Designed for Professionals: A sophisticated tool utilized by analysts, CFOs, and consultants.
- Accurate Data Integration: Preloaded financial data for Zhejiang HangKe Technology to enhance precision.
- Versatile Scenario Analysis: Effortlessly test various forecasts and assumptions.
- Comprehensive Outputs: Automatically computes intrinsic value, NPV, and essential metrics.
- User-Friendly Interface: Step-by-step guidance to navigate through the calculations.
Who Should Utilize This Product?
- Investors: Assess the valuation of Zhejiang HangKe Technology Incorporated (688006SS) prior to making investment decisions.
- CFOs and Financial Analysts: Enhance valuation workflows and evaluate financial forecasts.
- Startup Founders: Understand the valuation methods applied to leading public companies like Zhejiang HangKe Technology (688006SS).
- Consultants: Create detailed valuation reports for their clients.
- Students and Educators: Leverage real-world data to develop and teach valuation methodologies.
Contents of the Template
- Operating and Balance Sheet Data: Pre-filled historical data and forecasts for Zhejiang HangKe Technology Incorporated (688006SS), including revenue, EBITDA, EBIT, and capital expenditures.
- WACC Calculation: A dedicated sheet for calculating the Weighted Average Cost of Capital (WACC), featuring parameters such as Beta, risk-free rate, and share price.
- DCF Valuation (Unlevered and Levered): Customizable Discounted Cash Flow models that provide intrinsic value with thorough calculations.
- Financial Statements: Pre-loaded financial statements (annual and quarterly) to facilitate comprehensive analysis.
- Key Ratios: A compilation of profitability, leverage, and efficiency ratios relevant to Zhejiang HangKe Technology Incorporated (688006SS).
- Dashboard and Charts: A visual summary of valuation outputs and assumptions for easy analysis of results.
Disclaimer
All information, articles, and product details provided on this website are for general informational and educational purposes only. We do not claim any ownership over, nor do we intend to infringe upon, any trademarks, copyrights, logos, brand names, or other intellectual property mentioned or depicted on this site. Such intellectual property remains the property of its respective owners, and any references here are made solely for identification or informational purposes, without implying any affiliation, endorsement, or partnership.
We make no representations or warranties, express or implied, regarding the accuracy, completeness, or suitability of any content or products presented. Nothing on this website should be construed as legal, tax, investment, financial, medical, or other professional advice. In addition, no part of this site—including articles or product references—constitutes a solicitation, recommendation, endorsement, advertisement, or offer to buy or sell any securities, franchises, or other financial instruments, particularly in jurisdictions where such activity would be unlawful.
All content is of a general nature and may not address the specific circumstances of any individual or entity. It is not a substitute for professional advice or services. Any actions you take based on the information provided here are strictly at your own risk. You accept full responsibility for any decisions or outcomes arising from your use of this website and agree to release us from any liability in connection with your use of, or reliance upon, the content or products found herein.