
|
Micro-Fabricação Avançado Equipamento Inc. China (688012.Ss) Avaliação DCF |
Totalmente Editável: Adapte-Se Às Suas Necessidades No Excel Ou Planilhas
Design Profissional: Modelos Confiáveis E Padrão Da Indústria
Pré-Construídos Para Uso Rápido E Eficiente
Compatível com MAC/PC, totalmente desbloqueado
Não É Necessária Experiência; Fácil De Seguir
Advanced Micro-Fabrication Equipment Inc. China (688012.SS) Bundle
Ganhe domínio sobre sua análise de avaliação de Micro-Fabricação Inc. China (688012Ss) usando nossa sofisticada calculadora DCF! Equipado com dados reais (688012Ss), este modelo do Excel permite ajustar as previsões e suposições para determinar com precisão o valor intrínseco do Micro-Fabricação Avançado Inc. China.
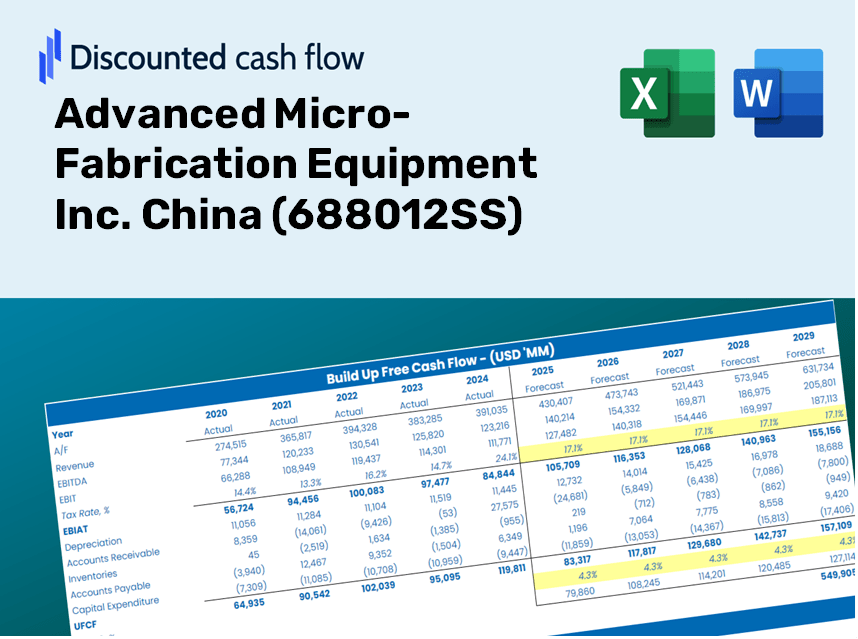
Discounted Cash Flow (DCF) - (USD MM)
| Year | AY1 2020 |
AY2 2021 |
AY3 2022 |
AY4 2023 |
AY5 2024 |
FY1 2025 |
FY2 2026 |
FY3 2027 |
FY4 2028 |
FY5 2029 |
|---|---|---|---|---|---|---|---|---|---|---|
| Revenue | 2,273.3 | 3,108.1 | 4,739.8 | 6,263.5 | 9,065.2 | 12,829.4 | 18,156.8 | 25,696.2 | 36,366.5 | 51,467.4 |
| Revenue Growth, % | 0 | 36.72 | 52.5 | 32.15 | 44.73 | 41.52 | 41.52 | 41.52 | 41.52 | 41.52 |
| EBITDA | 206.6 | 526.8 | 996.2 | 1,375.8 | 1,445.4 | 2,180.1 | 3,085.4 | 4,366.7 | 6,179.9 | 8,746.0 |
| EBITDA, % | 9.09 | 16.95 | 21.02 | 21.97 | 15.94 | 16.99 | 16.99 | 16.99 | 16.99 | 16.99 |
| Depreciation | 77.9 | 94.4 | 118.1 | 161.0 | 113.6 | 327.9 | 464.0 | 656.7 | 929.4 | 1,315.4 |
| Depreciation, % | 3.43 | 3.04 | 2.49 | 2.57 | 1.25 | 2.56 | 2.56 | 2.56 | 2.56 | 2.56 |
| EBIT | 128.7 | 432.4 | 878.1 | 1,214.8 | 1,331.9 | 1,852.3 | 2,621.4 | 3,709.9 | 5,250.4 | 7,430.6 |
| EBIT, % | 5.66 | 13.91 | 18.53 | 19.4 | 14.69 | 14.44 | 14.44 | 14.44 | 14.44 | 14.44 |
| Total Cash | 2,636.9 | 11,169.5 | 10,265.3 | 8,959.3 | 8,595.6 | 12,696.5 | 17,968.7 | 25,430.1 | 35,989.7 | 50,934.3 |
| Total Cash, percent | .0 | .0 | .0 | .0 | .0 | .0 | .0 | .0 | .0 | .0 |
| Account Receivables | 384.3 | 631.4 | 780.0 | 1,250.3 | 1,484.5 | 2,309.7 | 3,268.8 | 4,626.1 | 6,547.0 | 9,265.7 |
| Account Receivables, % | 16.91 | 20.31 | 16.46 | 19.96 | 16.38 | 18 | 18 | 18 | 18 | 18 |
| Inventories | 1,063.9 | 1,762.2 | 3,401.9 | 4,260.3 | 7,038.5 | 8,234.7 | 11,654.1 | 16,493.5 | 23,342.3 | 33,035.0 |
| Inventories, % | 46.8 | 56.7 | 71.77 | 68.02 | 77.64 | 64.19 | 64.19 | 64.19 | 64.19 | 64.19 |
| Accounts Payable | 422.2 | 734.6 | 960.1 | 1,305.1 | 1,680.0 | 2,612.9 | 3,698.0 | 5,233.5 | 7,406.7 | 10,482.3 |
| Accounts Payable, % | 18.57 | 23.64 | 20.26 | 20.84 | 18.53 | 20.37 | 20.37 | 20.37 | 20.37 | 20.37 |
| Capital Expenditure | -251.8 | -496.5 | -1,505.1 | -870.5 | -895.1 | -2,118.8 | -2,998.7 | -4,243.8 | -6,006.0 | -8,500.0 |
| Capital Expenditure, % | -11.08 | -15.98 | -31.75 | -13.9 | -9.87 | -16.52 | -16.52 | -16.52 | -16.52 | -16.52 |
| Tax Rate, % | 5.46 | 5.46 | 5.46 | 5.46 | 5.46 | 5.46 | 5.46 | 5.46 | 5.46 | 5.46 |
| EBITAT | 123.5 | 386.1 | 816.2 | 1,079.2 | 1,259.2 | 1,710.0 | 2,420.1 | 3,425.1 | 4,847.3 | 6,860.1 |
| Depreciation | ||||||||||
| Changes in Account Receivables | ||||||||||
| Changes in Inventories | ||||||||||
| Changes in Accounts Payable | ||||||||||
| Capital Expenditure | ||||||||||
| UFCF | -1,076.3 | -649.0 | -2,133.6 | -614.1 | -2,159.8 | -1,169.3 | -3,408.0 | -4,823.1 | -6,825.9 | -9,660.3 |
| WACC, % | 4.53 | 4.53 | 4.53 | 4.53 | 4.53 | 4.53 | 4.53 | 4.53 | 4.53 | 4.53 |
| PV UFCF | ||||||||||
| SUM PV UFCF | -21,919.7 | |||||||||
| Long Term Growth Rate, % | 4.00 | |||||||||
| Free cash flow (T + 1) | -10,047 | |||||||||
| Terminal Value | -1,900,860 | |||||||||
| Present Terminal Value | -1,523,266 | |||||||||
| Enterprise Value | -1,545,186 | |||||||||
| Net Debt | -7,029 | |||||||||
| Equity Value | -1,538,157 | |||||||||
| Diluted Shares Outstanding, MM | 621 | |||||||||
| Equity Value Per Share | -2,475.25 |
What to Expect
- Reliable AMEC Financial Data: Comes pre-loaded with Advanced Micro-Fabrication Equipment’s historical and forecasted data for accurate analysis.
- Customizable Template: Easily adjust essential inputs such as revenue growth, WACC, and EBITDA margin.
- Instant Calculations: Watch the intrinsic value of AMEC update in real-time as you make adjustments.
- Professional Valuation Tool: Tailored for investors, analysts, and consultants aiming for precise DCF evaluations.
- User-Friendly Layout: Intuitive structure and straightforward instructions suitable for all skill levels.
Key Features
- Accurate Financial Data: Gain access to reliable pre-loaded historical figures and forward-looking estimates for Advanced Micro-Fabrication Equipment Inc. (688012SS).
- Customizable Forecast Parameters: Modify highlighted cells for key variables like WACC, growth rates, and profit margins.
- Real-time Calculations: Enjoy automatic updates to DCF, Net Present Value (NPV), and cash flow assessments.
- User-Friendly Dashboard: View straightforward charts and summaries to effectively interpret your valuation findings.
- Designed for All Levels: An intuitive and uncomplicated layout suitable for investors, CFOs, and consultants alike.
How It Functions
- Download: Obtain the pre-configured Excel file featuring Advanced Micro-Fabrication Equipment Inc. (688012SS) financial data.
- Customize: Tailor forecasts, including revenue growth, EBITDA %, and WACC as per your requirements.
- Update Automatically: Experience real-time updates for intrinsic value and NPV calculations.
- Test Scenarios: Generate various projections and compare results seamlessly.
- Make Decisions: Leverage the valuation outcomes to refine your investment approach.
Why Opt for This Calculator?
- Comprehensive Solution: Combines DCF, WACC, and financial ratio analyses in one convenient tool.
- Flexible Inputs: Modify the yellow-highlighted fields to explore different scenarios.
- In-Depth Analysis: Automatically computes the intrinsic value and Net Present Value for Advanced Micro-Fabrication Equipment Inc. (688012SS).
- Preloaded Information: Contains historical and forecasted data for reliable starting points.
- Expert-Level Quality: Perfect for financial analysts, investors, and business consultants.
Who Can Benefit from This Product?
- Investors: Evaluate Advanced Micro-Fabrication Equipment Inc. (688012SS) to make informed stock trading decisions.
- CFOs and Financial Analysts: Enhance the valuation process and assess financial projections.
- Startup Founders: Understand the valuation methods applied to established companies like Advanced Micro-Fabrication Equipment Inc. (688012SS).
- Consultants: Create detailed valuation reports to support your clients' needs.
- Students and Educators: Utilize current data for practical applications and instruction in valuation methodologies.
Contents of the Template
- Pre-Filled DCF Model: Advanced Micro-Fabrication Equipment Inc.'s (688012SS) financial data ready for immediate analysis.
- WACC Calculator: Comprehensive calculations for the Weighted Average Cost of Capital.
- Financial Ratios: Assess profitability, leverage, and operational efficiency for Advanced Micro-Fabrication Equipment Inc. (688012SS).
- Editable Inputs: Modify assumptions like growth rates, profit margins, and CAPEX to align with your analysis.
- Financial Statements: Access annual and quarterly reports for in-depth evaluation.
- Interactive Dashboard: Effortlessly visualize essential valuation metrics and outcomes.
Disclaimer
All information, articles, and product details provided on this website are for general informational and educational purposes only. We do not claim any ownership over, nor do we intend to infringe upon, any trademarks, copyrights, logos, brand names, or other intellectual property mentioned or depicted on this site. Such intellectual property remains the property of its respective owners, and any references here are made solely for identification or informational purposes, without implying any affiliation, endorsement, or partnership.
We make no representations or warranties, express or implied, regarding the accuracy, completeness, or suitability of any content or products presented. Nothing on this website should be construed as legal, tax, investment, financial, medical, or other professional advice. In addition, no part of this site—including articles or product references—constitutes a solicitation, recommendation, endorsement, advertisement, or offer to buy or sell any securities, franchises, or other financial instruments, particularly in jurisdictions where such activity would be unlawful.
All content is of a general nature and may not address the specific circumstances of any individual or entity. It is not a substitute for professional advice or services. Any actions you take based on the information provided here are strictly at your own risk. You accept full responsibility for any decisions or outcomes arising from your use of this website and agree to release us from any liability in connection with your use of, or reliance upon, the content or products found herein.