
|
Kingsemi Co., Ltd. (688037.SS) Avaliação DCF |
Totalmente Editável: Adapte-Se Às Suas Necessidades No Excel Ou Planilhas
Design Profissional: Modelos Confiáveis E Padrão Da Indústria
Pré-Construídos Para Uso Rápido E Eficiente
Compatível com MAC/PC, totalmente desbloqueado
Não É Necessária Experiência; Fácil De Seguir
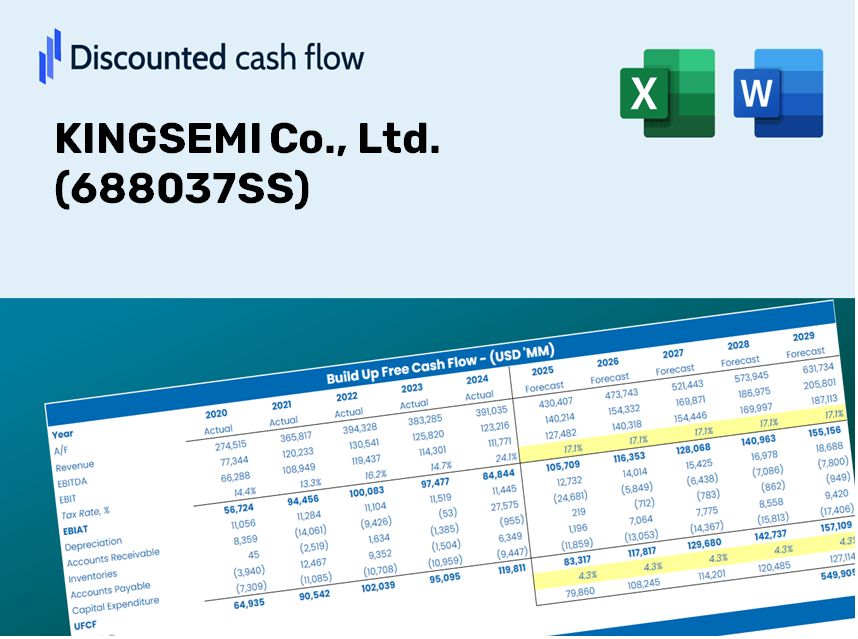
KINGSEMI Co., Ltd. (688037.SS) Bundle
Para investidores e analistas, a calculadora DCF da Kingsemi Co., Ltd. (688037Ss) é o seu recurso preferido para uma avaliação precisa. Equipado com dados reais do KingSemi, você pode ajustar as previsões e observar imediatamente os efeitos.
Discounted Cash Flow (DCF) - (USD MM)
| Year | AY1 2020 |
AY2 2021 |
AY3 2022 |
AY4 2023 |
AY5 2024 |
FY1 2025 |
FY2 2026 |
FY3 2027 |
FY4 2028 |
FY5 2029 |
|---|---|---|---|---|---|---|---|---|---|---|
| Revenue | 328.9 | 828.7 | 1,384.9 | 1,717.0 | 1,753.6 | 2,600.7 | 3,857.1 | 5,720.4 | 8,483.9 | 12,582.3 |
| Revenue Growth, % | 0 | 151.95 | 67.12 | 23.98 | 2.13 | 48.31 | 48.31 | 48.31 | 48.31 | 48.31 |
| EBITDA | 19.0 | 74.1 | 177.7 | 255.0 | 137.9 | 261.4 | 387.7 | 574.9 | 852.7 | 1,264.6 |
| EBITDA, % | 5.77 | 8.94 | 12.83 | 14.85 | 7.87 | 10.05 | 10.05 | 10.05 | 10.05 | 10.05 |
| Depreciation | 11.8 | 15.0 | 25.7 | 40.8 | 56.8 | 67.0 | 99.4 | 147.4 | 218.6 | 324.2 |
| Depreciation, % | 3.6 | 1.81 | 1.86 | 2.38 | 3.24 | 2.58 | 2.58 | 2.58 | 2.58 | 2.58 |
| EBIT | 7.1 | 59.0 | 152.0 | 214.2 | 81.1 | 194.4 | 288.3 | 427.5 | 634.1 | 940.4 |
| EBIT, % | 2.17 | 7.12 | 10.97 | 12.47 | 4.63 | 7.47 | 7.47 | 7.47 | 7.47 | 7.47 |
| Total Cash | 442.4 | 232.1 | 1,098.2 | 743.0 | 1,582.6 | 1,772.8 | 2,629.3 | 3,899.4 | 5,783.2 | 8,577.0 |
| Total Cash, percent | .0 | .0 | .0 | .0 | .0 | .0 | .0 | .0 | .0 | .0 |
| Account Receivables | 97.2 | 380.6 | 340.6 | 595.4 | 606.5 | 880.9 | 1,306.4 | 1,937.6 | 2,873.6 | 4,261.7 |
| Account Receivables, % | 29.56 | 45.93 | 24.59 | 34.68 | 34.59 | 33.87 | 33.87 | 33.87 | 33.87 | 33.87 |
| Inventories | 402.3 | 932.2 | 1,213.3 | 1,637.3 | 1,816.2 | 2,512.2 | 3,725.8 | 5,525.6 | 8,195.0 | 12,153.8 |
| Inventories, % | 122.31 | 112.49 | 87.61 | 95.36 | 103.57 | 96.59 | 96.59 | 96.59 | 96.59 | 96.59 |
| Accounts Payable | 217.7 | 399.1 | 420.8 | 506.6 | 773.9 | 1,135.8 | 1,684.5 | 2,498.3 | 3,705.2 | 5,495.1 |
| Accounts Payable, % | 66.18 | 48.17 | 30.38 | 29.51 | 44.13 | 43.67 | 43.67 | 43.67 | 43.67 | 43.67 |
| Capital Expenditure | -92.6 | -191.8 | -206.5 | -475.8 | -224.3 | -555.0 | -823.1 | -1,220.7 | -1,810.4 | -2,685.0 |
| Capital Expenditure, % | -28.14 | -23.14 | -14.91 | -27.71 | -12.79 | -21.34 | -21.34 | -21.34 | -21.34 | -21.34 |
| Tax Rate, % | 9.89 | 9.89 | 9.89 | 9.89 | 9.89 | 9.89 | 9.89 | 9.89 | 9.89 | 9.89 |
| EBITAT | 6.6 | 60.1 | 136.9 | 190.0 | 73.1 | 179.4 | 266.0 | 394.5 | 585.1 | 867.7 |
| Depreciation | ||||||||||
| Changes in Account Receivables | ||||||||||
| Changes in Inventories | ||||||||||
| Changes in Accounts Payable | ||||||||||
| Capital Expenditure | ||||||||||
| UFCF | -356.0 | -748.5 | -263.3 | -838.0 | -17.1 | -917.0 | -1,548.1 | -2,296.0 | -3,405.2 | -5,050.1 |
| WACC, % | 4.46 | 4.47 | 4.45 | 4.45 | 4.45 | 4.46 | 4.46 | 4.46 | 4.46 | 4.46 |
| PV UFCF | ||||||||||
| SUM PV UFCF | -11,232.9 | |||||||||
| Long Term Growth Rate, % | 2.00 | |||||||||
| Free cash flow (T + 1) | -5,151 | |||||||||
| Terminal Value | -209,818 | |||||||||
| Present Terminal Value | -168,731 | |||||||||
| Enterprise Value | -179,964 | |||||||||
| Net Debt | -366 | |||||||||
| Equity Value | -179,598 | |||||||||
| Diluted Shares Outstanding, MM | 138 | |||||||||
| Equity Value Per Share | -1,304.21 |
Benefits of Choosing KINGSEMI Co., Ltd. (688037SS)
- Comprehensive Financial Model: Leverage KINGSEMI’s actual performance data for an accurate DCF valuation.
- Complete Forecast Flexibility: Modify projections for revenue growth, profit margins, WACC, and other essential metrics.
- Real-Time Calculations: Automatic updates let you view results instantly as you make adjustments.
- Professional-Grade Template: A polished Excel file tailored for sophisticated valuation processes.
- Adaptable and Repeatable: Designed for versatility, allowing for ongoing use in detailed forecasting.
Key Features
- Pre-Configured Data: Historical financial statements and pre-populated forecasts for KINGSEMI Co., Ltd. (688037SS).
- Completely Customizable Inputs: Adjust parameters such as WACC, tax rates, revenue growth, and EBITDA margins.
- Real-Time Results: View the intrinsic value of KINGSEMI Co., Ltd. (688037SS) as it updates instantly.
- Interactive Visual Outputs: Dashboard graphs highlight valuation results and essential metrics.
- Designed for Precision: A professional-grade tool tailored for analysts, investors, and finance professionals.
How It Works
- Download: Obtain the pre-prepared Excel file containing KINGSEMI Co., Ltd.'s (688037SS) financial data.
- Customize: Modify projections, including revenue growth, EBITDA %, and WACC as per your analysis.
- Update Automatically: Watch as the intrinsic value and NPV calculations refresh in real-time.
- Test Scenarios: Generate various forecasts and compare results instantly.
- Make Decisions: Leverage the valuation findings to inform your investment strategy for KINGSEMI Co., Ltd. (688037SS).
Reasons to Use the KINGSEMI Calculator
- All-in-One Solution: Integrates DCF, WACC, and financial ratio analyses seamlessly.
- Flexible Inputs: Modify the highlighted cells to explore different financial scenarios.
- In-Depth Analysis: Automatically computes KINGSEMI's intrinsic value and Net Present Value.
- Preloaded Information: Historical and projected data provide reliable starting points for analysis.
- Expert-Grade Quality: Perfect for financial analysts, investors, and business advisors.
Who Can Benefit from KINGSEMI Co., Ltd. (688037SS)?
- Individual Investors: Gain valuable insights to make informed decisions regarding your shares in KINGSEMI Co., Ltd. (688037SS).
- Financial Analysts: Enhance your valuation processes with comprehensive financial models tailored for KINGSEMI Co., Ltd. (688037SS).
- Consultants: Provide clients with accurate and efficient valuation analysis for KINGSEMI Co., Ltd. (688037SS).
- Business Owners: Learn from the valuation strategies of KINGSEMI Co., Ltd. (688037SS) to inform your own business plans.
- Finance Students: Explore practical valuation methods using real data from KINGSEMI Co., Ltd. (688037SS).
Contents of the Template
- Operating and Balance Sheet Data: Pre-populated historical data and forecasts for KINGSEMI Co., Ltd. (688037SS), including metrics such as revenue, EBITDA, EBIT, and capital expenditures.
- WACC Calculation: A dedicated sheet for the Weighted Average Cost of Capital (WACC), featuring parameters like Beta, risk-free rate, and stock price.
- DCF Valuation (Unlevered and Levered): Customizable Discounted Cash Flow models outlining intrinsic value with comprehensive calculations.
- Financial Statements: Pre-loaded annual and quarterly financial statements to facilitate analysis.
- Key Ratios: Includes profitability, leverage, and efficiency ratios specifically for KINGSEMI Co., Ltd. (688037SS).
- Dashboard and Charts: Visual representation of valuation outputs and assumptions to help in the analysis of results.
Disclaimer
All information, articles, and product details provided on this website are for general informational and educational purposes only. We do not claim any ownership over, nor do we intend to infringe upon, any trademarks, copyrights, logos, brand names, or other intellectual property mentioned or depicted on this site. Such intellectual property remains the property of its respective owners, and any references here are made solely for identification or informational purposes, without implying any affiliation, endorsement, or partnership.
We make no representations or warranties, express or implied, regarding the accuracy, completeness, or suitability of any content or products presented. Nothing on this website should be construed as legal, tax, investment, financial, medical, or other professional advice. In addition, no part of this site—including articles or product references—constitutes a solicitation, recommendation, endorsement, advertisement, or offer to buy or sell any securities, franchises, or other financial instruments, particularly in jurisdictions where such activity would be unlawful.
All content is of a general nature and may not address the specific circumstances of any individual or entity. It is not a substitute for professional advice or services. Any actions you take based on the information provided here are strictly at your own risk. You accept full responsibility for any decisions or outcomes arising from your use of this website and agree to release us from any liability in connection with your use of, or reliance upon, the content or products found herein.